Download
1 / 69
690 likes | 710 Views
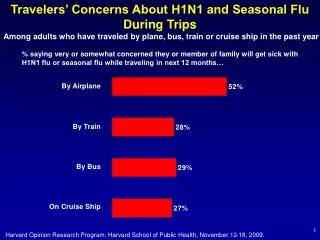
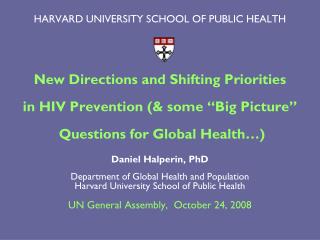
Impact of negative selection on common variant disease architectures. Alkes L. Price Harvard School of Public Health October 19, 2018 Slides of this talk: google “Alkes HSPH”. What is negative selection?.

E N D
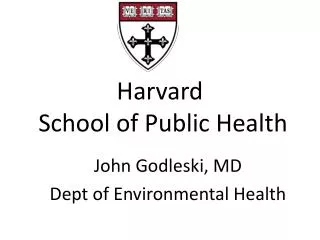
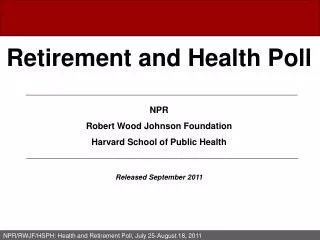
Impact of negative selection on common variant disease architectures Alkes L. PriceHarvard School of Public Health October 19, 2018 Slides of this talk: google “Alkes HSPH”
What is negative selection? Negative selection is the negative pressure on allele frequencies of mutations that reduce fitness. Allele frequency Allele frequency 0 0 Time Time Kryukov et al. 2007 Am J Hum Genet, Kiezun et al. 2013 PLoS Genet
Negative selection: causal effect on trait is larger for rare and low-frequency variants Let p be minor allele frequency (MAF). Let β be per-allele causal effect on disease/trait. Let h2 = β22p(1−p) be variance explained by a SNP. Selection: α model Var(β) ~ [p(1−p)]α E(h2) ~ [p(1−p)]1+α rare variants explain more h2 if α < 0 (negative selection) than if α = 0 (no selection) Speed et al. 2012 Am J Hum Genet; also see Schoech et al. biorxiv 09/13/17 (analytical derivations support validity of α model for p above a threshold)
Negative selection: causal effect on trait is larger for rare and low-frequency variants Let p be minor allele frequency (MAF). Let β be per-allele causal effect on disease/trait. Let h2 = β22p(1−p) be variance explained by a SNP. Selection: α model Var(β) ~ [p(1−p)]α E(h2) ~ [p(1−p)]1+α rare variants explain more h2 if α < 0 (negative selection) α = −0.38 across 25 UK Biobank traits (rare variants: larger causal effects but smaller per-SNP h2 vs. common variants) Schoech et al. biorxiv 09/13/17; also see Zeng et al. 2018 Nat Genet
Rare variants explain limited trait heritability, despite larger causal effects + many rare variants MAF = 5% α = 0 (no selection) Schoech et al. biorxiv 09/13/17; also see Zeng et al. 2018 Nat Genet
Beyond the α model: does negative selection impact common variant disease architectures? MAF = 5% α = 0 (no selection) Schoech et al. biorxiv 09/13/17; also see Zeng et al. 2018 Nat Genet
1. LD-dependent architectures 2. Functional architectures 3. Polygenicity Outline
1. LD-dependent architectures 2. Functional architectures 3. Polygenicity Outline
What does “LD-dependent architecture” mean? • SNPs with higher LD have higher average χ2 association statistics due to increased tagging of causal variants. Pritchard & Przeworski 2001 Am J Hum Genet
What does “LD-dependent architecture” mean? • SNPs with higher LD have higher average χ2 association statistics due to increased tagging of causal variants. “LD-dependent architecture”: dependence of causal effect sizes on the level of LD of a SNP. Speed et al. 2012 Am J Hum Genet
What does “LD-dependent architecture” mean? • Common SNPs have higher LD and higher causal variance than rare SNPs => SNPs with higher LD have higher causal variance. Schoech et al. biorxiv 09/13/17; also see Zeng et al. 2018 Nat Genet
What does “LD-dependent architecture” mean? • Common SNPs have higher LD and higher causal variance than rare SNPs => SNPs with higher LD have higher causal variance. “LD-dependent architecture”: dependence of causal effect sizes on the level of LD of a SNP, after conditioning on MAF.
Inferring LD-dependent architectures from summary statistics using S-LDSC Extend S-LDSC (Finucane et al. 2015 Nat Genet) to continuous annot. q: E(χ2) = 1 + NΣqτqLDscoreq LDscoreq(SNP m) = = normalized conditional effect of annot. q (proportionate change in trait h2 per 1 s.d. increase in annot. q) am,q = value of annot. q at SNP m τq = conditional effect of annot. q h2 = genome-wide trait heritability m m Gazal et al. 2017 Nat Genet
Inferring LD-dependent architectures using continuous LLD annotation Level of LD (LLD ): MAF-adjusted LD score (MAF-stratified quantile normalization) LDscoreLLD(SNP m) for continuous LLD annotation = • Include “baseline model” annotations (Finucane et al. 2015 Nat Genet) • Also include binary annotations for 10 common SNP MAF bins • Simulations confirm robust results (not shown) Gazal et al. 2017 Nat Genet
SNPs with lower MAF-adjusted level of LD (LLD) have larger causal effect sizes Same sign of effect across all 56 traits (average N=101K)
Many annotations correlated to LD could contribute to LD-dependent architectures • LD-related annotations • Predicted allele age (ARGweaver; Rasmussenet al. 2014 PLoS Genet) • LLD in Africans (LLD-AFR) • Recombination rate (±10kb window; Hussin et al. 2015 Nat Genet) • GC-content (±1Mb window; Loh et al. 2015b Nat Genet) • Replication timing (Koren et al. 2012 Am J Hum Genet) • Background selection (1−B statistic; McVicker et al. 2009 PLoS Genet) • Nucleotide diversity (SNPs per kb; ±10kb window) • CpG content (±50kb window) • Functional annotations (Finucane et al. 2015 Nat Genet) • Coding, regulatory, conserved, etc.
Many annotations correlated to LD could contribute to LD-dependent architectures | LD-related annotations Functional annotations from “baseline model” (Finucane et al. 2015 Nat Genet)
Many annotations correlated to LD could contribute to LD-dependent architectures | LD-related annotations Functional annotations from “baseline model” (Finucane et al. 2015 Nat Genet)
Many annotations correlated to LD could contribute to LD-dependent architectures | LD-related annotations Functional annotations from “baseline model” (Finucane et al. 2015 Nat Genet)
Many LD-related annotations impact causal effect sizes Annotation + baseline model + MAF Annotation + MAF Meta-analysis of 31 independent traits
Many LD-related annotations impact causal effect sizes Annotation + baseline model + MAF Annotation + MAF r = −0.63 • Recombination rate has discordant sign of effect(Hill & Robertson 1966 Genet Res) • Heritability is enriched in SNPs with low LLD in low recombination rate regions Meta-analysis of 31 independent traits
Many LD-related annotations impact causal effect sizes after conditioning on baseline model Annotation + MAF Annotation + baseline model + MAF Meta-analysis of 31 independent traits
Many LD-related annotations impact causal effect sizes after conditioning on baseline model Annotation + MAF Annotation + baseline model + MAF • LLD effect is 0.37x smaller when including annotations from baseline model • Some, but not all, of LD-dependent architecture due to DHS, enhancers, etc. 0.37x Meta-analysis of 31 independent traits
Many LD-related annotations impact causal effect sizes after conditioning on baseline model Annotation + MAF Annotation + baseline model + MAF • LLD effect is 0.51x smaller after adding baseline model • Predicted allele age has largest effect. Meta-analysis of 31 independent traits
Many LD-related annotations impact causal effect sizes in joint fit with baseline model baseline-LD model Annotation + MAF Joint-fit annotations + baseline model + MAF Annotation + baseline model + MAF Meta-analysis of 31 independent traits
Many LD-related annotations impact causal effect sizes in joint fit with baseline model baseline-LD model Annotation + MAF Joint-fit annotations + baseline model + MAF Annotation + baseline model + MAF • LLD effect is 0.51x smaller af • 6 significant annotations in joint fit Meta-analysis of 31 independent traits
Many LD-related annotations impact causal effect sizes in joint fit with baseline model baseline-LD model Annotation + MAF Joint-fit annotations + baseline model + MAF Annotation + baseline model + MAF • LLD effect is 0.51x smaller af • predicted allele age has largest effect Meta-analysis of 31 independent traits
Forward simulations show that negative selection explains LD-dependent architectures Forward Simulations: impact on s Annotation + MAF Joint-fit annotations + baseline model + MAF Annotation + baseline model + MAF • Forward simulations using SLiM (Messer 2013 Genetics) under African-European demographic model (Gravel et al. 2011 PNAS) • Jointly regress selection coeff s on 4 LD-related annotations and minor allele frequency X X 31 traits Simulations
Quintiles illustrate large effects of LD-related annotations from baseline-LD model 40% • Youngest 20% explain 3.8x more heritability than oldest 20% 30% Proportion of heritability 20% 10% 0% vs. 1.8x for MAF
Quintiles illustrate large effects of TMRCA annotation inferred using ASMC • ASMCavg annotation: Average TMRCA inferred by Ascertained Sequentially Markovian Coalescent (ASMC) in GoNL WGS data • Jointly statistically significant with other LD-related annotations (τ* = ‒0.25±0.01) • Low-TMRCA 20% explain 3.8x more heritability than high-TMRCA 20% Proportion of heritability Palamara et al. 2018 Nat Genet
LD-dependent architectures can lead to bias in estimates of heritability and functional enrichment Modeling LD-dependent architectures is critically important. Speed et al. 2012 Am J Hum Genet, Gusev et al. 2013 PLoS Genet, Yang et al. 2015 Nat Genet, Speed et al. 2017 Nat Genet, Gazal et al. 2017 Nat Genet
How well does the baseline-LD model fit the data? Idea (Speed et al. 2017 Nat Genet): use out-of-sample likelihoods for formal model comparisons Speed et al. 2017 Nat Genet: LDAK model > infinitesimal model (“GCTA model”) in analysis of 1000G SNPs
2.8M 1000G SNPs: LDAK model > GCTA model y-axis = change in log likelihood vs. LDAK model (16 UK Biobank traits) “GCTA” = infinitesimal model 4.6M SNPs from HRC 2.8M SNPs from 1000G ASHG 2018 poster 3432/W Price + Gazal et al. biorxiv 10/16/18
4.6M HRC SNPs: GCTA model (>) LDAK model y-axis = change in log likelihood vs. LDAK model (16 UK Biobank traits) “GCTA” = infinitesimal model 4.6M SNPs from HRC 2.8M SNPs from 1000G ASHG 2018 poster 3432/W Price + Gazal et al. biorxiv 10/16/18
baseline-LD > LDAK and GCTA in both SNP sets y-axis = change in log likelihood vs. LDAK model (16 UK Biobank traits) “GCTA” = infinitesimal model (also see Yang et al. 2015 Nat Genet; LDMS model) “Gazal-LD” = LD + MAF annotations only from baseline-LD model “baseline-LD+LDAK” = model with baseline-LD + LDAK annotations 4.6M SNPs from HRC 2.8M SNPs from 1000G ASHG 2018 poster 3432/W Price + Gazal et al. biorxiv 10/16/18
1. LD-dependent architectures 2. Functional architectures 3. Polygenicity Outline image from Shlyueva et al. 2014 Nat Rev Genet
Common variant functional architectures: coding + regulatory (tissue-specific) Coding variants explain ~10% Regulatory variant enrichments of common variant h2 are often tissue/cell-type-specific Finucane et al. 2015 Nat Genet; also see Finucane et al. 2018 Nat Genet
Low-frequency variant functional architectures: ??? + ??? Coding variants explain ??? Regulatory variants explain ??? of low-frequency variant h2 of low-frequency variant h2 ??? ??? ??? ??? Coding variants likely important for low-frequency variant architectures: UK10K 2015 Nature, Astle et al. 2016 Cell, Marouli et al. 2017 Nature
Inferring low-frequency variant functional architectures by extending S-LDSC Multi-linear Regression: χ2 statistic = 1 + Σq(Nτq)LDscoreq • Separate annotations for common and low-frequency SNPs • Also include binary annotations for 5 low-frequency MAF bins • UK Biobank target samples + UK10K LD reference samples • Simulations confirm robust results (not shown) m m, ASHG 2018 poster 2699/F Gazal + Gazal et al. 2018 Nat Genet
Inferring low-frequency variant functional architectures by extending S-LDSC Common variant enrichment (CVE) of an annotation = prop. of hc2 / prop. of common SNPs Low-frequency variant enrichment (LFVE) of an annotation = prop. of hlf2 / prop. of low-frequency SNPs • Separate annotations for common and low-frequency SNPs • Also include binary annotations for 10 low-frequency MAF bins • UK Biobank target samples + UK10K LD reference samples • Simulations confirm robust results (not shown) ASHG 2018 poster 2699/F Gazal + Gazal et al. 2018 Nat Genet
LFVE is correlated to CVELFVE > CVE when CVE is large 33 main annotations: r(LFVE,CVE) = 0.79 Meta-analysis across 40 UK Biobank traits (average N = 363K) assoc. method: BOLT-LMM (Loh et al. 2018 Nat Genet) Low-frequency variant enrichment (LFVE) Common variant enrichment (CVE)
LFVE is correlated to CVELFVE > CVE when CVE is large Non-synonymous variants: 17.3% of hlf2 vs. 2.1% of hc2 (Even larger LFVE for n.s. variants • predicted as damaging: PolyPhen-2 • in genes under strong selection: shet) 33 main annotations: r(LFVE,CVE) = 0.79 Low-frequency variant enrichment (LFVE) Common variant enrichment (CVE)
LFVE ≈ CVE for most regulatory annotations but LFVE > CVE for brain annotations 637 cell-type-specific (CTS) annotation-trait pairs with significant CVE (Finucane et al. 2018 Nat Genet) 55 brain annotation-trait pairs with LFVE/CVE>2x Low-frequency variant enrichment (LFVE) Common variant enrichment (CVE)
LFVE ≈ CVE for most regulatory annotations but LFVE > CVE for brain annotations H3K4me3 in brain DPFC-Neuroticism: 56.9% of hlf2 vs. 11.7% of hc2 (P = 0.0002) Low-frequency variant enrichment (LFVE) Common variant enrichment (CVE)
LFVE/CVE ratio depends primarily on strength of selection sdn = avg selection coefficient of deleterious de novo variants π = prob. that de novo variant is causal for trait Forward simulations (SLiM2 + τEyre-Walker) LFVE/CVE ratio Non-synonymous variants: LFVE/CVE=5x, sdn=‒0.003 55 brain annotation-trait pairs: LFVE/CVE>2x, sdn<‒0.0006 (potentially useful for WGS) Proportion of causal variants (π)
1. LD-dependent architectures 2. Functional architectures 3. Polygenicity Outline image from Evangelou et al. 2018 Nat Genet
Complex traits are extremely polygenic Systolic blood pressure: GWAS of 1 million people identifies 901 genome-wide significant loci explaining 5.7% of trait variance (vs. total SNP-heritability = 21%) Evangelou et al. 2018 Nat Genet; also see Purcell et al. 2009 Nature, Yang et al. 2010 Nat Genet, Stahl et al. 2012 Nat Genet, PGC-SCZ 2014 Nature, Loh et al. 2015b Nat Genet, Zhang et al. 2018 Nat Genet
Omnigenic model: polygenicity arises from extraordinary biological complexity Boyle et al. 2017 Cell also see Wray et al. 2018 Cell, Liu et al. biorxiv 09/24/18