Download
1 / 39
390 likes | 857 Views
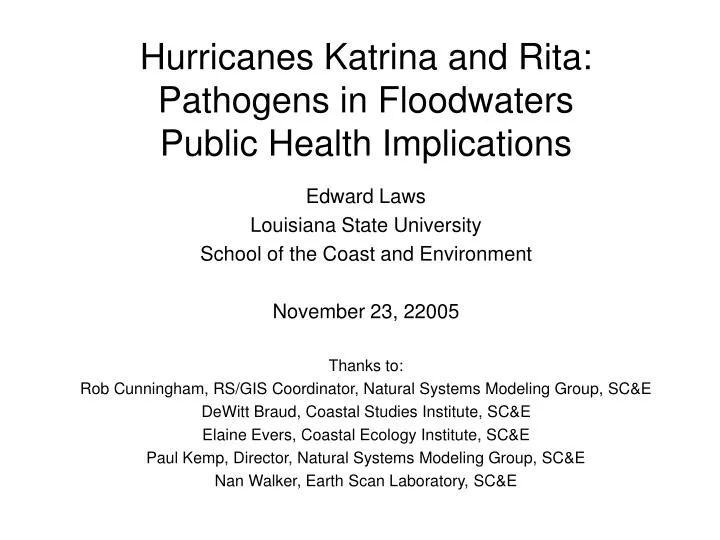
Hurricanes Katrina and Rita: Pathogens in Floodwaters Public Health Implications. Edward Laws Louisiana State University School of the Coast and Environment November 23, 22005 Thanks to: Rob Cunningham, RS/GIS Coordinator, Natural Systems Modeling Group, SC&E

E N D
Hurricanes Katrina and Rita:Pathogens in FloodwatersPublic Health Implications Edward Laws Louisiana State University School of the Coast and Environment November 23, 22005 Thanks to: Rob Cunningham, RS/GIS Coordinator, Natural Systems Modeling Group, SC&E DeWitt Braud, Coastal Studies Institute, SC&E Elaine Evers, Coastal Ecology Institute, SC&E Paul Kemp, Director, Natural Systems Modeling Group, SC&E Nan Walker, Earth Scan Laboratory, SC&E
Vertical Temperature Structure Loop Current
New Orleans neighborhoodsSource: New Orleans Community Data Center
10 meter SPOT Satellite Image: 2 Sep 05 With Water depth overlays London Ave Canal Breaks 17th Street canal break Industrial Canal Overwash
1 meter IKONOS satellite image: 2 Sep 05 Lakeview 17th St Canal Breach
Hurricane Katrina Response: Microbes and HABs NSF SGER Rapid Funding Mechanism Collaborative & Interdisciplinary (>$600,000 total) • Hawaii NSF NIEHS OHH Center (Steward) • University of Miami NSF NIEHS OHH Center (Solo Gabriele) • WHOI NSF NIEHS OHH Center (Gast) • Louisiana State University (Hou)
Hurricane Katrina Response: Microbes and HABs Using Remote Sensing, targeted sampling of Lake Pontchartrain and Canals for: • Microbes • indicator organisms (E coli, Enterococcus) • Pathogenic bacteria (Cholera, Vibrio, Staph, Bacteroides) • Viruses (Enterovirus, Norovirus, Coliphage) • Protozoa (Cryptosporidium, Giardia) • HABs • Cyanobacteria • Heavy metals and Hydrocarbons • Environmental parameters
17th Street Canal pumping station: intakeSource: Tom Van Biersel
17th Street Canal pumping station: outflowSource: Tom Van Biersel
E. Coli and enterococci concentrations in canal water samples Enterococci concentrations (CFU/100 ml) E. coli concentrations (CFU/100 ml) 60000 1600 1400 50000 1200 40000 1000 (CFU/100ml) Enterococci (CFU/100ml) 30000 800 S3 S3 E coli 600 S1 20000 S1 400 10000 200 0 0 0 0 7 S1 7 19 S1 19 28 28 31 S3 31 40 S3 40 45 45 Days 54 Days 54
Transect 1 over time control 80000 S4 60000 S3 S2 E coli (CFU/100 ml) 40000 S1 20000 0 0 10 23 38 Days Transect 1: E. coli per 100 ml
Transect 1 over time control 200 S4 150 S3 Enterococci (CFU/100 ml) 100 S2 50 S1 0 0 10 23 38 day Transect 1: Enterococcus per 100 ml
Comments and Conclusions The dewatering of New Orleans was completed much faster than initially predicted. Concentrations of indicator bacteria in canals and Lake Pontchartrain declined to background levels on a timeframe of 1-2 weeks. Impact of discharged floodwaters on Lake Pontchartrain was detectable only within a few kilometers of the shoreline.


![Write Down Your Favorite 1] Foods 2] Things 3] People 4] Places to Relax 5] Future Dreams](https://cdn2.slideserve.com/3879593/slide1-dt.jpg)