Download
1 / 40
400 likes | 727 Views
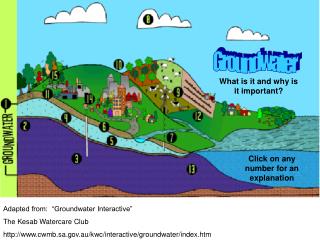
Groundwater Trends in Utah. Patrick M. Lambert, U.S. Geological Survey, Utah Water Science Center 2011 Utah Water Users Workshop March 14-16, 2011 St. George Utah. The groundwater resource in Utah.

E N D
Groundwater Trends in Utah Patrick M. Lambert, U.S. Geological Survey, Utah Water Science Center 2011 Utah Water Users Workshop March 14-16, 2011 St. George Utah
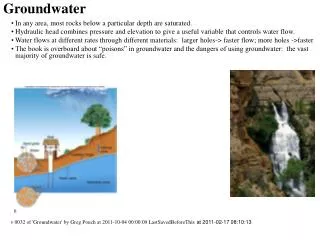
An aquifer can be compared to a bank account and groundwater occurring in the aquifer as money in the account • Infiltration of precipitation • Seepage from surface water • Percolation of irrigation water • Subsurface inflow Recharge/Deposits Discharge/ Withdrawals • Discharge to streams and springs • Transpired by plants • Subsurface outflow Storage/Savings • Withdrawal from wells • Artificial recharge – Injection, infiltration ponds
Just as a bank account must be balanced, withdrawals from an aquifer must be balanced by some combination of increased recharge, decreased discharge, or removal from storage.
… withdrawals from an aquifer must be balanced Predevelopment conditions Development conditions Natural and Induced recharge 4,500 cfs Natural and Induced recharge 13,400 cfs Pumpage 13,500 cfs Rate of decrease in storage: 1,700 cfs Discharge to surface-water bodies, springs, ET 4,500 cfs Discharge to surface-water bodies, springs, ET 1,600 cfs Hypothetical groundwater system
Why do we care what the balances of Utah groundwater accounts are and which way we are trending? Development conditions Potential negative effects of groundwater depletion • Increased pumping costs • Changes in water quality • Reduced flows to streams, lakes, springs, flowing wells • Land Subsidence Pumpage 13,500 cfs Rate of decrease in storage: 1,700 cfs Discharge to surface-water bodies and ET 1,600 cfs Such effects, while variable , happen to some degree with any groundwater withdrawal.
Why do we care what the balances of Utah groundwater accounts are and which way they are trending? As with other resources, society must weigh the benefits against the consequences of groundwater use. In order to preserve and optimize the use of critical groundwater resources, we observe and assess to provide the information necessary to make informed choices in issues that have long-term effects.
Utah Groundwater Resources • Withdrawal from the 16 areas shaded in the figure made up 87% of total withdrawal for the state in 2009 (2009 statewide withdrawals = 969,000 acre-ft) From Groundwater Conditions in Utah, Spring of 2010: Utah Division of Water Resources Cooperative Investigations Report no. 51 - http://ut.water.usgs.gov/publications/GW2010.pdf Areas of groundwater development in Utah
Utah Groundwater Resources • Most wells in Utah yield water from unconsolidated basin fill deposits. • Smaller percentage of withdrawal occurs from consolidated rock mainly in eastern and southern parts of the state where basin fill aquifers have limited occurrence and capacity.
Trends in groundwater use in Utah 2009 estimated withdrawals from wells = 969,000 acre-ft (Modified from Gates, 2004, Groundwater Development in Utah and Effects on Groundwater levels and Chemical Quality: in Groundwater in Utah; Resource, Protection, and Remediation, Utah Geological Association Publication 31)
Trends in groundwater use • State wide annual total groundwater withdrawal has increased by about 740,000 acre-ft since 1939 and about 340,000 acre-ft since 1963. • Irrigation withdrawals made up over 57% of total withdrawals in 2009. • Fluctuations in irrigation withdrawals are the main cause of the fluctuations in total withdrawal.
Irrigation, and thus total annual withdrawals, fluctuate mostly in response to changes in precipitation and resulting changes in surface-water flow and its availability for irrigation.
Withdrawals of groundwater from wells in Utah, 2009 2009 From Groundwater Conditions in Utah, Spring of 2010: Utah Division of Water Resources Cooperative Investigations Report no. 51 - http://ut.water.usgs.gov/publications/GW2010.pdf
Utah Groundwater State-Wide Monitoring Network • Program began in 1962 • Annual water-level measurements in about 1,000 wells • Water-quality sampling at about 100 wells • Cooperatively funded by Utah Department of Natural Resources, Divisions of Water Rights and Water Resources and the USGS Cooperative Water Program, more recently by the UDEQ (2005)
Groundwater Trends Average declines in water levels in major groundwater basins – March 1980 to March 2010 Depicted range of declines represents average of water-level changes at all measured wells within a basin. Based on data presented in Groundwater Conditions in Utah, Spring of 2010: Utah Division of Water Resources Cooperative Investigations Report no. 51 - http://ut.water.usgs.gov/publications/GW2010.pdf
Groundwater Trends – Northern Utah • Curlew and Cache Valleys • Groundwater use is predominantly for irrigation • Currently, no significant trend in annual withdrawals • Moderate fluctuations groundwater levels and storage – Generally declining water levels 1930 2010 Cache Valley Unless otherwise stated, water-level change maps in this and subsequent slides are from Groundwater Conditions in Utah, Spring of 2010: Utah Division of Water Resources Cooperative Investigations Report no. 51 - http://ut.water.usgs.gov/publications/GW2010.pdf Water-level change from March 1980 to March 2010
Groundwater Trends – North-Central Utah • East Shore, Salt Lake Valley, Tooele Valley, Utah and Goshen Valleys • Groundwater use is predominantly for public supply • Substantial public-supply withdrawals in high-population basins – Salt Lake (137,000 acre-ft in 2009) and Utah valleys (109,000 acre-ft) • Zones of significant water-level declines including flowing well areas 2010 1930 1930 2010 Water-level change from March 1980 to March 2010 East Shore Area
Groundwater Trends – North-Central Utah Water-level change from Feb 1980 to Feb 2010 1930 2010 1930 2010 1930 2010 Salt Lake Valley
Groundwater Trends – North-Central Utah 1930 2010 Northern Utah Valley Water level change in the principal basin-fill aquifer, 1981-2004 Negative values indicate water-level declines From Hydrology of Northern Utah Valley, Utah County, Utah, 1975-2005: U.S. Geological Survey Scientific Investigations Report 2008-5197 http://pubs.usgs.gov/sir/2008/5049/
Groundwater Trends – Southwestern Utah • Pahvant, Milford, Parawan, Cedar Valley, Beryl-Enterprise, Central Virgin River • Groundwater use predominantly for irrigation • Significant increases in total withdrawals from 1940 through mid 70’s • Largest and most extensive water-level declines observed in groundwater basins with significant groundwater development
Water-level change from March 1980 to March 2010 Groundwater Trends – Southwestern Utah 1930 2010 1930 2010 Pahvant Valley
Groundwater Trends – Southwestern Utah 1930 2010 Water-level change from March 1980 to March 2010 Cedar Valley
Groundwater Trends – Southwestern Utah Water-level change from March 1980 to March 2010 Beryl-Enterprise area
Water Quality trends are also important! Withdrawals from aquifer zones containing good-quality water can allow adjacent poorer-quality water to migrate and degrade water quality. Where groundwater is withdrawn from an aquifer, surface water of differing quality may be drawn into the aquifer.
Increasing trends in dissolved-solids concentrations indicated in Utah long-term monitoring network Areas where increases in dissolved-solids concentrations in groundwater are observed • Curlew • Goshen • Pahvant • Milford • Beryl-Enterprise • Cedar Valley (Iron County) • Salt Lake Valley
Water quality sampling began in 1964. • Sampling ended after 2001. • Restarted in 2005, 60 wells. • Sampled about 104 wells in 2010 • Network of about 300 wells, each sampled every 3 years. Groundwater quality monitoring network
Trends in chemical quality of groundwater Curlew Valley 8 -27 -809 Graphs of annual withdrawals and dissolved solids concentrations in this and subsequetn slides are from Groundwater Conditions in Utah, Spring of 2010: Utah Division of Water Resources Cooperative Investigations Report no. 51 - http://ut.water.usgs.gov/publications/GW2010.pdf
Trends in chemical quality of groundwater Beryl-Enterprise
Salt Lake Valley - dissolved-solids concentrations 2,000- 5,000 mg/l 1,000- 2,000 mg/l • Groundwater comprises about 30% of water use in the valley (most groundwater withdrawals are for public supply) • Range of water-quality results from different sources of water to the aquifer and water rock interaction 250- 500 mg/l < 250 mg/l 500- 1,000 mg/l > 5,000 mg/l Decadal-Scale Changes in Dissolved-Solids Concentrations in Groundwater Used in Public Supply, Salt Lake Valley, Utah: U.S. Geological Survey Fact Sheet 2010-3073 - http://pubs.usgs.gov/fs/2010/3073/ Distribution of dissolved-solids concentrations in the principal aquifer in Salt Lake Valley, 1998-2002
Salt Lake Valley groundwater quality trends • Confining layers and upward vertical gradients inhibit vertical flow of poor quality water to confined aquifer however… • Substantial increases in TDS in the principal aquifer are occurringin some areas
Central and Eastern and Salt Lake Valley 500- 1,000 mg/l 250- 500 mg/l < 250 mg/l Decadal-Scale Changes in Dissolved-Solids Concentrations in Groundwater Used in Public Supply, Salt Lake Valley, Utah: U.S. Geological Survey Fact Sheet 2010-3073 - http://pubs.usgs.gov/fs/2010/3073/ • Colored zones indicate distribution of dissolved solids. • Outlines indicate areas where concentrations of dissolved solids increased by 20% or more from 1988-92 to 1998-2002.
Utility of basic data and groundwater flow models to understand the effects of water use on groundwater systems – an example Goal – Information to preserve and optimize the use of critical groundwater resources Northern Utah Valley
25 ft 20 ft 30 ft Application to groundwater resource management From USGS Northern Utah Valley (NUV) Groundwater assessment and flow modeling project - Projected effect of future increased pumping in Northern Utah Valley - Test case of 2x current pumping Drawdown, compared to 2004 water levels • Lower water levels (drawdown) in large areas of the aquifer • Reduced natural discharge (Computed drawdowns from simulated 2x 2004 pumping for 30 years) Utah Lake
Simulation-Optimization modeling to assess groundwater systems - NUV Optimization Example 1: Problem design • Decision Variables • 47 individual wells • Constraints • Maximum flow rate of 2,500 gpm per well • Drawdown ≤ 20 ft • Total of all withdrawal ≥ 89,000 acre-ft/year • Objective • Maximize Withdrawal Existing wells in 2004 with capacity > 300 gpm Application of the USGS groundwater flow and optimization (Groundwater Management (GWM) process tool) models for Northern Utah Valley Scenario to meet future groundwater demands • > 70 wells pumping 44,500 acre-ft/yr in 2004 • Increase to 89,000 acre-ft/yr over 30 years
Example 1: results • Only 86,300 acre-ft/yr could be withdrawn and still meet constraints • Results show which wells must be pumped & how much • 27 wells versus >70 wells • 100 to 2,400 gpm • most average 500 gpm • 4 wells > 1,500 gpm • 11 wells > 1,000 gpm • Reduced overall drawdown by 5 to 10 ft • This result was achieved in one run of the model Example 1 Drawdown, Compared to 2004 water levels. Resulting from optimized pumping from existing wells. 19 ft 17 ft 19 ft (Computed drawdowns from simulated 2x 2004 pumping for 30 years)
Example 1: comparison 2x 2004 pumping Drawdown, 25 ft Changes in ground-water discharge % change (base case) % change (Ex.1) 20 ft -25% -35% -14% Utah Lake Drains, springs, & flowing wells Evapotranspiration -23% -39% -15% 30 ft Drawdown, Ex.1 • 97% of the target withdrawal using only 27 wells (versus more than 70 wells) • Significant improvement in drawdown 19 ft 17 ft 19 ft (Computed drawdowns from simulated 2x 2004 pumping for 30 years)
Groundwaterwatch.usgs.gov or NWIS Mapper http://ut.water.usgs.gov/
References • Groundwater Conditions in Utah, Spring of 2010: Utah Division of Water Resources Cooperative Investigations Report no. 51 - http://ut.water.usgs.gov/publications/GW2010.pdf • Groundwater Development in Utah and Effects on Groundwater levels and Chemical Quality: in Groundwater in Utah; Resource, Protection, and Remediation, Utah Geological Association Publication 31 • Decadal-Scale Changes in Dissolved-Solids Concentrations in Groundwater Used in Public Supply, Salt Lake Valley, Utah: U.S. Geological Survey Fact Sheet 2010-3073 - http://pubs.usgs.gov/fs/2010/3073/ • Groundwater Depletion Across the Nation, U.S. Geological Survey Fact Sheet-103-03 - http://pubs.usgs.gov/fs/fs-103-03/ • Hydrology of Northern Utah Valley, Utah County, Utah, 1975-2005: U.S. Geological Survey Scientific Investigations Report 2008-5197 http://pubs.usgs.gov/sir/2008/5049/ • Three-Dimensional Numerical Model of Ground-Water Flow in Northern Utah Valley, Utah County, Utah - http://pubs.usgs.gov/sir/2008/5049/ • Use of Simulation-Optimization Modeling to Assess Regional Groundwater Systems: U.S. Geological Survey Fact Sheet 2005-3095 - http://pubs.usgs.gov/fs/2005/3095/
Questions? O.E. Meinzer USGS Groundwater Division Chief, 1912-1946