Download
1 / 13
130 likes | 133 Views
Site-Level Interim Synthesis Update. Kevin Schaefer, Dan Riciutto, Ken Davis, Peter Thornton Coordinators. Presentation to NACP SSG, 20 Aug 2008. Site-level synthesis: Objectives.

E N D
Site-Level Interim Synthesis Update Kevin Schaefer, Dan Riciutto, Ken Davis, Peter Thornton Coordinators Presentation to NACP SSG, 20 Aug 2008
Site-level synthesis: Objectives • Starting at the spatial scale of individual sites, establish quantitative framework that allows NACP investigators to answer the question: • “Are the various measurement and modeling estimates of carbon fluxes consistent with each other - and if not, why?” • Improve quantification of uncertainty for forward models and site-based measurements. • Identify strengths and weaknesses in models and measurements. • Migrate new knowledge up-scale in coordination with regional and continental-scale efforts.
Site-level MDC: Approach • Anchor the comparison at AmeriFlux sites • Multiple years of energy, water and carbon fluxes • Ancillary physical and biological measurements (“template” exists, encourage site PIs to fill it in) • Initial selection of 25-30 potential sites • Introduce data from inventories as available. • Measurement teams produce their own best estimates of fluxes and flux uncertainty at each site. • Standardized filtering and gap-filling. • Standardized approach to uncertainty estimates • Random error • Systematic error (e.g. due to instrumentation, advection, data filtering, gap-filling)
Site-level MDC: Approach (cont.) • Modeling teams produce their own best estimates of fluxes and flux uncertainty at each site for each model. • Protocol specifies model inputs and provides goals and examples for obtaining model uncertainty. • Each group can tackle the uncertainty problem however they see fit and are best able. • Groups encouraged to categorize multiple sources of uncertainty, for example due to: • Parameter estimation • Model structure and/or process representation • Initial / boundary conditions (e.g. representation of disturbance history, veg type, or diagnostic LAI) • Surface weather drivers • Each model has unique characteristics, and each modeling team has unique capabilities – avoid over-specifying the model uncertainty approach.
Site-level MDC: Approach (cont.) • Measurement – modeling synthesis • Multiple teams will tackle several aspects of model-data comparison in parallel. • Protocol includes some example statistical tests that can incorporate the measured and modeled fluxes and their uncertainties to determine if they are consistent. • Teams will have flexibility to introduce additional statistical methods in the analysis, as needed. • Evaluation at multiple time scales: • Multi-year annual mean • Interannual variability • Seasonal • Synoptic • Diurnal • Workshop to initiate analysis
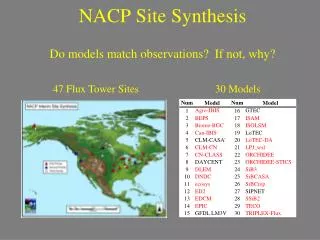
Progress report • Preliminary site list compiled (~35 sites) • Agreement from all site PIs to either actively participate in synthesis or to provide data • Collaboration with Canadian Carbon Program approved by its Board of Directors (as of 14 Aug 2008). • Gap-filled flux data and surface weather data now available for all site-years • ~70 participants, ~15 models, substantial overlap with regional synthesis group
Progress report (cont’d) • Subset of models have been run for Howland site as preliminary test of protocol.
Howland: NEE comparison – site extracted from regional modeling results
Next steps • Finalize site selection, modeling participants, and timeline (August) • Simulations for all sites (September) • Preliminary analysis of model and observation uncertainty (October) • Workshop: detailed analysis of results (November) • Additional analysis (December-January) • Results ready for Feb 2009 NACP Investigators’ meeting