Download
1 / 106
1.06k likes | 1.2k Views
U.S. TRAVEL AND TOURISM OUTLOOK AND TRENDS Research, Idea & Promotion. www.rolandberger.com. TIA Mission Statement.

E N D
U.S. TRAVEL AND TOURISM OUTLOOK AND TRENDS Research, Idea & Promotion • www.rolandberger.com
TIA Mission Statement The mission of the Travel Industry Association of America is to represent the whole of the U.S. travel industry to promote and facilitate increased travel to and within the United States.
Travel and Tourism - 2003 America’s 3rd Largest Retail Sales Industry • $555 billion total expenditures • $95 billion in tax revenue for federal, state and local governments One of America’s Largest Employers • Employs 7.2 million people directly. • Tourism is 1st, 2nd, or 3rd largest employer in 30 states and the District of Columbia • $158.4 billion in travel-generated payroll Source: Travel Industry Association of America (TIA)
Tumbling from the PeaksBetween 2000 and 2003 • Domestic business travel down 15% • Domestic airline travel down 14% • Overseas travel to the U.S. down 30%
International Visitor Arrivals to U.S. from Key Countries • 2003 % Change Recovery to • (in millions)2003/20002000 Expected • Canada 12.7 -14% 2007 • United Kingdom 3.9 -16 2006 • Japan 3.2 -37 Beyond 2007 • Germany 1.2 -34 Beyond 2007 • France 0.7 -37 Beyond 2007 • Brazil 0.4 -53 Beyond 2007 • Argentina 0.2 -72 Beyond 2007 Source: Office of Travel and Tourism Industries
Bright Spot • Domestic Leisure Travel • Slow but steady growth • Stay closer to home • Highway travel • Short getaways • Visits to small towns, rural areas • Economize
Travel Performance – First Three Quarters 2004 • During Jan – Sept, 2004, domestic travel up nearly 3% • Leisure travel up 2.0%, exceeded by 6.8% gain in business/convention travel • Strong gains in air and hotel volume over 2003 • International travel to U.S. exceeding expectations Source: Travel Industry Association of America
Visitor Trends Occurring More in Past Year Percent of TIA Members Reporting Source: Travel Industry Association of America
NTA Operators’ Products Percent of NTA Operators Source: National Tour Association
RV Travel Strong • 7.8% of all U.S. vehicle-owning households own an RV, up from 7.3% in 1997 • 7.2 million RVs on the road, compared to 6.4 million in 1997 • RV Shipments Up 14% in 2004 • RV Rentals Up Nearly 33% in 2003 and 2004 Combined • 6.4% of RV Rentals by International Visitors Source: Recreation Vehicle Industry Association
National Parks and Public Lands • National Park Visitation up 4% through November 2004; • Sale of Park Passes up 8% • See America’s National Parks partnership with TIA, National Park Service and National Park Foundation
Travel Policies – Air Business Travelers 2004 and 2002 Percent of Air Business Travelers Source: Travel Industry Association of America and National Business Travel Association
Alternative Technologies Used By Business Travelers in Past Year, 2004 Percent of Business Travelers Source: Travel Industry Association of America and National Business Travel Association
Effectiveness and Efficiency of Technology to Replace Travel, 2004 and 2002 Percent of Air Business Travelers – Top Two Boxes Source: Travel Industry Association of America and National Business Travel Association
AUTO TRAVEL PERFORMANCE • U.S. auto travel up 2% through September 2004 • Still holding up due to: • Shifts from air, especially for short-distance trips • Closer-to-home travel • Increasing interest in family travel • Increased interest in RVs
Airline Turbulence • Domestic air travel up 5% over 2003, but still 10% below 2000. • International is up 14% over 2003, but better yet, up 5% over 2000. • Exchange rates make U.S. even more of a bargain • US Air, United and ATA in bankruptcy • Airline losses $8 billion in 2004; $23 billion between 2001 - 2003
U.S. Hotel Performance Strengthens In 2004 % Change over Prior Year Source: Smith Travel Research
Changes to Domestic Advertising and Marketing Programs Among 90% of Members with Domestic Marketing Programs Source: Travel Industry Association of America
Americans’ Economic Assessments Are Mixed • 41% now rate economic conditions as positive, up slightly • 48% say economy getting better vs. 42% who say it is getting worse • Noticeable decline in citing economy as most important problem facing America – now 30% vs. 38% - 40% in autumn of 2004 • Only 33% says it’s a good time to “find a quality job”, vs. 62% who say it’s a bad time Source: Gallup Surveys
U.S. Leisure Outlook • Leisure travel intentions remain strong • Trends of the last few years will continue but some return to more normal patterns • Growth in air travel exceeding that of auto travel • Continued focus on family and connections but greater participation in other activities too • Spending up 4% in 2004 over 2003
Domestic Leisure Travel Will Continue to Grow Slowly Million of Person-Trips Source: Travel Industry Association of America
Domestic Business Travel Will Rise but Still Below 2000 Levels Millions of Person-Trips Note: Does not include combined business/leisure travel Source: TIA and Global Insight
U.S. Hotel Performance Expected to Remain Healthy in 2005 % Change over Prior Year Source: Smith Travel Research
Forecasts for Growth in U.S. Domestic Travel, 2005 • Total Domestic Person-Trips 2.0% • Leisure 1.7% • Business 3.6% • Auto 2.0% • Air 2.0% • Hotel Room Demand 3.0% Source: TIA, ATA, Smith Travel Research
International Visits Expected to Increase Again in 2005 Arrivals in Millions Source: Office of Travel and Tourism Industries (OTTI)
Travel Expenditures Will Continue to Rise Billions p = preliminary; f = forecast Source: TIA; OTTI
Online Travel Planning Steady and Booking Continues to Rise Millions Source: Travel Industry Association of America
How We Sell and Distribute Travel Changed Forever • Internet for leisure and business • Pricing more transparent; consumer in control • Encourages late bookings • Increases competition • Online hotel sales soaring
Long Term Trends • Who will be tomorrow’s travelers and what will they do? • How will technology and changing work/leisure patterns affect the nature of travel planning and travel itself? • How will we reach them? • What types of tourism are likely to grow?
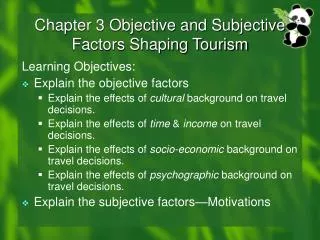
Key Demographic Trends • Aging of population • Changes in households • Rising education • Geographic shifts • Cultural diversity • Influence of women • Growing niche markets
Percent Change in Population by Age, 2010/2000 and 2020/2000 (Percent Change) Source: U.S. Bureau of the Census
“Junior” Matures (Age 55 - 64) More Likely Than Other Travelers To …… • Travel farther away from home • Stay away from home longer • Include two or more destinations in one trip • Engage in more activities • Travel with only one other household member, likely their spouse • Spend more per trip Source: TIA
Maturity Trends • Increase in adult-only travel parties • Slower growth in travelers looking for “traditional” family experiences • Interest in local heritage & culture increases • Maturialism
Important Reasons for U.S. Family Vacations (% of 2002 Family Vacationers) Family Togetherness 87% Get Away from Stress 74 Rest and Relaxation 71 Visit Friends/Relatives 62 Excitement/New Experiences 50 Physical Activity 43 New Places/People 43 For Luxury/Feel Pampered 25 Sources: Better Homes & Gardens and Travel Industry Association of America
Top 10 Activities Among U.S. Domestic Travelers, 2003 • Shopping 30% • Social/Family Event 27 • Outdoor Recreation 11 • City/Urban Sightseeing 10 • Rural Sightseeing 10 • Beach Activities 10 • Historical Places/Museums 8 • Theme/Amusement Park 7 • Gambling 7 • National/State Parks 7 Source: TIA
81% of Travelers Included Cultural/Arts/Heritage Activities on Trips in Past Year Source: TIA and Smithsonian Magazine
Cultural, Arts, Heritage or Historic Activities Included on Trips in Past Year(% of U.S. Adults) Source: TIA and Smithsonian Magazine
More Older Women Living Alone Millions Men Women Source: U.S. Bureau of the Census
Millennial Generation – Great Potential for the Future • Children of the Boomers • Born between 1977 and 1994; 10 – 27 years of age in 2004 • 72 million, 28% of population • 13% of those age 20 – 24 were born outside the U.S.
Millennial Generation – Great Potential for the Future • Racially and ethnically diverse • Very independent • Feel powerful • But of those age 20 – 24, 50% of men and 36% of women still live with or are dependent on parents • Media-savvy • Technology leaders
Travel by Minority Groups Increasing • Hispanics 77.1 million person-trips (8% of total) • African-Americans 75.2 million person-trips (7% of total) • Asian-Americans 33.1 million (3% of total) Source: TIA
Ethnic Groups to Grow to 50% of Population by 2050 % Distribution of Population Source: U.S. Bureau of the Census
Hispanics will Increasingly Dominate Millions Source: U.S. Bureau of the Census
Changing Nature of Work and Leisure • Blurring of boundaries of space and time for work and leisure • Dramatic growth in work flexibility • Reduced need to travel solely for business, but combined business/leisure and leisure travel will grow • Both business and leisure travel more motivated by self-actualization
Consumer Trends Likely to Build • More focus on doing well while doing good • Growing interest in making contribution to society • Could stimulate rise in “Volun-tourism” • Increasing emphasis on quality of life and lifestyle enhancement • Rising emphasis on environment and sustainability
Consumer Trends Likely to Build • Education more recognized and promoted as a lifelong goal to enhance self-actualization - personal best • Leisure as learning
Types of Tourism Likely to Grow • Visit Friends/Relatives/Reunions/ Intergenerational and Grand-Travel • Combined Business and Leisure Travel • Second Homes and Time Share • Destination Spas • Enrichment Tourism