Download
1 / 24
340 likes | 700 Views
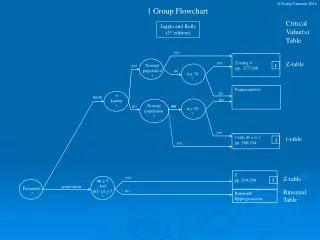
Estimasi Parameter. TIP-FTP-UB. Statistika Inferensial. Terbagi dua bagian : Estimasi ( estimation ) Uji hipotesis ( test of hypotheses ). Estimasi. Terbagi menjadi dua bagian : Estimasi titik Estimasi interval. Point & Interval Estimation….

E N D
Estimasi Parameter TIP-FTP-UB
StatistikaInferensial Terbagiduabagian: • Estimasi (estimation) • Ujihipotesis (test of hypotheses)
Estimasi Terbagimenjadiduabagian: • Estimasititik • Estimasi interval
Point & Interval Estimation… For example, suppose we want to estimate the mean summer income of a class of business students. For n=25 students, mean income is calculated to be 400 $/week. point estimate interval estimate An alternative statement is: The mean income is between 380 and 420 $/week.
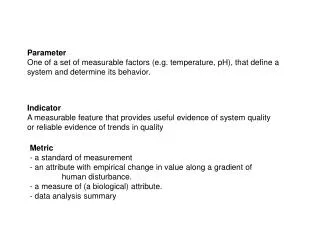
Estimator Qualities desirable in estimators: • Unbiased An unbiased estimator of a population parameter is an estimator whose expected value is equal to that parameter. Jadijikaadalahparameter danadalah estimator unbiased dari parameter apabiladipenuhi. • Consistent An unbiased estimator is said to be consistent if the difference between the estimator and the parameter grows smaller as the sample size grows larger. • Relatively efficient If there are two unbiased estimators of a parameter, the one whose variance is smaller is said to be relatively efficient.
Estimasititik • Sebuahnilaitunggal yang digunakanuntukmengestimasisebuah parameter disebuttitik estimator (ataucukup estimator), sedangkan proses untukmengestimasititikdisebutestimasititik (point estimation).
EstimasiTitik • Dapat dibuktikanbahwaadalah estimator tak bias daridanadalah estimator tak bias dari.
Estimasi Interval • Proses untukmelakukanestimasidenganmenggunakan interval disebutestimasi interval. • Derajatkepercayaandalammengestimasidisebutkoefisienkonfidensi. • Misalnyamerupakan estimator untuk parameter , sedangkan A dan B adalahnilai-nilai estimator tersebutberdasarkansampeltertentu, makakoefisienkepercayaannyadinyatakandengan: diartikanbahwakitamerasa 100()% percaya (yakin) bahwaterletakdiantara A dan B. disebut interval konfidensi (atauselangkonfidensi), sedangkan A dan B disebutbatas-bataskepercayaan. A disebutlower confidence limit, B disebutupper confidence limit
Interval KonfidensiuntukRataan • Untuk diketahui Jikaadalahrataansampel random berukuran n yang diambildaripopulasi normal (ataupopulasitak normal denganukuransampel n) dengandiketahui, maka interval konfidensi 100bagiditentukanoleh: • Untuktakdiketahui Jikadanberturut-turutadalahrataandanvariansidarisampel random berukurankecil (n<30) yang diambildaripopulasitaknormaldengantakdiketahu, maka interval konfidensi 100bagiditentukanoleh:
Four commonly used confidence levels… Confidence Level cut & keep handy! Table 10.1
Example 1 A computer company samples demand during lead time over 25 time periods: It is known that the standard deviation of demand over lead time is 75 computers. We want to estimate the mean demand over lead time with 95% confidence in order to set inventory levels…
Example 1 “We want to estimate the mean demand over lead time with 95% confidence in order to set inventory levels” Thus, the parameter to be estimated in the population is mean. And so our confidence interval estimator will be: IDENTIFY
Example 1 In order to use our confidence interval estimator, we need the following pieces of data: therefore: The lower and upper confidence limits are 340.76 and 399.56. Calculated from the data… Given
Interval Width… A wide interval provides little information. For example, suppose we estimate with 95% confidence that an accountant’s average starting salary is between $15,000 and $100,000. Contrast this with: a 95% confidence interval estimate of starting salaries between $42,000 and $45,000. The second estimate is much narrower, providing accounting students more precise information about starting salaries.
Interval Width… The width of the confidence interval estimate is a function of the confidence level, the populationstandard deviation, and the sample size…
Interval Width The width of the confidence interval estimate is a function of the confidence level, the populationstandard deviation, and the sample size A larger confidence level produces a w i d e r confidence interval:
Interval Width… The width of the confidence interval estimate is a function of the confidence level, the populationstandard deviation, and the sample size… Larger values of produce w i d e r confidence intervals
Interval Width The width of the confidence interval estimate is a function of the confidence level, the populationstandard deviation, and the sample size Increasing the sample size decreases the width of the confidence interval while the confidence level can remain unchanged. Note: this also increases the cost of obtaining additional data
Selecting the Sample Size We can control the width of the interval by determining the sample size necessary to produce narrow intervals. Suppose we want to estimate the mean demand “to within 5 units”; i.e. we want to the interval estimate to be: Since: It follows that
Selecting the Sample Size Solving the equation that is, to produce a 95% confidence interval estimate of the mean (±5 units), we need to sample 865 lead time periods (vs. the 25 data points we have currently).
Sample Size to Estimate a Mean The general formula for the sample size needed to estimate a population mean with an interval estimate of: Requires a sample size of at least this large:
Example 2 A lumber company must estimate the mean diameter of trees to determine whether or not there is sufficient lumber to harvest an area of forest. They need to estimate this to within 1 inch at a confidence level of 99%. The tree diameters are normally distributed with a standard deviation of 6 inches. How many trees need to be sampled?
1 Example 2 Things we know: Confidence level = 99%, therefore =.01 We want , hence W=1. We are given that = 6.
1 Example 2 We compute That is, we will need to sample at least 239 trees to have a 99% confidence interval of