Download

1 / 39
390 likes | 515 Views
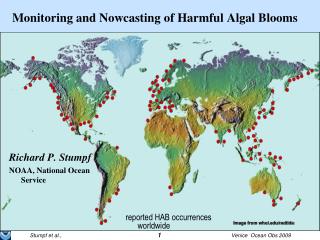
Population dynamics of toxic algal blooms in Lake Champlain. Edmund M. Hart, Nicholas J. Gotelli , Rebecca Gorney , Mary Watzin. If you bang your head against a wall long enough…. …s ometimes you break through. The problem…. Toxic algal blooms in Missisquoi Bay 2003 - 2006.

E N D
Population dynamics of toxic algal blooms in Lake Champlain Edmund M. Hart, Nicholas J. Gotelli, Rebecca Gorney, Mary Watzin
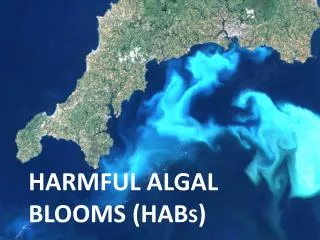
The problem… Toxic algal blooms in Missisquoi Bay 2003 - 2006
The problem… Growth rates of toxic algal blooms in Missisquoi Bay 2003 - 2006
The Question… What controls toxic algal bloom population dynamics in Missisquoi Bay?
The Algae Microcystis Anabaena
The data Microcystis 2003 • Data is from the Rubenstein Ecosystems Science Laboratory’s toxic algal bloom monitoring program • Data from dominant taxa (Microcystis 2003-2005, Anabaena 2006) • Averaged across all sites within Missisquoi bay for each year • Included only sites that had ancillary nutrient data
Ancillary data The competitors The nutrients Bacillariophyceae (diatoms) Chlorophyceae (green algae) TP SRP TN TN TP Cryptophyceae
Mathematical Framework Population models take on a general form of Basic types include:
Mathematical Framework Density dependent Random walk Exponential
Mathematical Framework Typically we analyze growth rates
Mathematical Framework Density dependent Random walk Exponential
Mathematical Framework Exogenous drivers
Mathematical Framework Exogenous drivers Ricker logistic growth Linear Linear
Mathematical Framework Exogenous drivers
A naïve analysis For each year fit the following models Assessed model fit with AICc (AIC + 2K(K+1)/n-K-1) Random walk / exponential growth Density dependent (endogenous factors) Environmental factors Competitors
A naïve analysis Microcystis 2004
A naïve analysis Microcystis 2004
A Problem Autocorrelation plot for Microcystis 2004 Not Stationary!
A solution? Detrending! Microcystis 2004
A solution? Probably not… • Need to have evidence to assume an environmental change results in shifting carrying capacity. • Can introduce spurious corellations Microcystis 2004
Another solution? Step detrending! Figure 1: Total counts of Soay sheep on the island of Hirta, showing two hypotheses for the apparent trend in the average number of sheep (dotted lines). A, Step trend. B, Linear trend. From Am Nat 168(6):784-795.
Another solution? Step detrending! Microcystis 2004 Too short, only 5 points!
Another solution! Time series “stitching”
Squint real hard I can see it because I’m always squinting to keep an eye out for ninjas! Toxic algal blooms in Missisquoi Bay 2003 - 2006
Phase portraits 2004 Microcystis
Phase portraits 2003 Microcystis 2005 Microcystis 2004 Microcystis 2006 Anabaena
A naïve analysis revisited For each year fit the following models Assessed model fit with AICc (AIC + 2K(K+1)/n-K-1) Random walk / exponential growth Density dependent (endogenous factors) Environmental factors Competitors Do all this again but with our two new series!
Decline phase dynamics * * Cr =Cryptophyceae
The problem revisited… Growth rates of toxic algal blooms in Missisquoi Bay 2003 - 2006
No, but what can we say then? • Toxic algal blooms have two distinct dynamic phases, a pattern observed across years and genera. • N:P important in the bloom phase, but not the decline, i.e. nutrients don’t always matter. • Once a bloom starts, you can’t really do anything about it. And one more thing about N:P
A final thought on N:P Population size and N:P on bloom phase data Partial residual plot of bloom phase growth rate model Smith 1983
Thanks! • VT EPSCoR • My collaborators • Nicholas Gotelli • Rebecca Gorney • Mary Watzin • The EPSCoR complex systems group perfunctory comic to keep you entertained during questions
Mathematical Framework Environmental Factors Effect on growth rate Effect on density dependence
Plankton Time Series Analysis A naïve approach Complex population dynamic approach Using a complex population dynamics modeling approach we parse four years of plankton time series into two distinct phases, bloom phase and decline phase, each with distinct dynamics. This method provides a far superior fit to traditional statistical correlative methods.