Download
1 / 7
390 likes | 756 Views
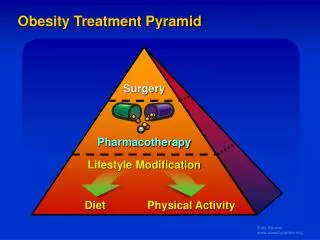
ACTIVITY: ODR Pyramid Graphs. Goal of the activity: To provide you with valuable information about how well PBIS is working in your school. You ’ ll be working with 2 graphs that reflect the data from your school: 1) Referral data 2) Suspension data

E N D
ACTIVITY: ODR Pyramid Graphs • Goal of the activity: To provide you with valuable information about how well PBIS is working in your school. • You’ll be working with 2 graphs that reflect the data from your school: • 1) Referral data • 2) Suspension data • On each graph, you’ll have 2 pyramids. The pyramid on the left indicates the number of students in your school who should be in Tier 1, Tier 2, and Tier 3 with respect to PBIS. • After you complete the data entry activity, the pyramid on the right will depict how your school actually looks right now with respect to the number of students on each Tier. • The next 2 slides are SAMPLES only and are meant to serve as examples. • Please follow the Directions on the 4th slide and use the 6th and 7th slides to complete the activity with the data for your school.
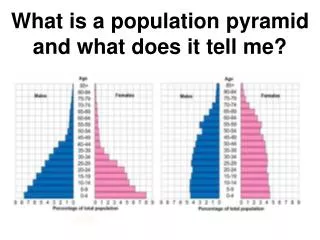
(5%) (10.6%) (15%) (25.8%) (63.6%) (80%) N = 700
(5%) (19.4%) (15%) (34.0%) (80%) (46.6%) N = 700
ODR Graphs – DirectionsReferrals & Suspensions • Go to Infinite Campus PBIS data; find total population of your school • Calculate number of students with 1-2 referrals • Calculate number of students with > 2 referrals • Subtract the number of students with 1-2 and >2 referrals from total population • Go to graph; put mouse pointer over graph; right click; click on “Edit data” • Go to spreadsheet; enter total population in columns on right side of data sheet • Enter data into boxes outlined in green • Go back to graph; go to pyramid on right; click on boxes labeled “put % of your students here;” enter the percentages from the bottom row on the spreadsheet • Develop a plan to address your PBIS program!
Below is a snapshot of the spreadsheet for each graph. The data sheet for each graph will pop up if you right click on the graph. Do not enter any data into the gray boxes OR in the boxes next to “Percent of Students.” If you enter your school’s data into the green boxes, these numbers will be calculated for you.
(5%) (put % for your school here) (15%) (put % for your school here) (put % for your school here) (80%) N=your school’s total population
(5%) (put % for your school here) (15%) (put % for your school here) (80%) (put % for your school here) N=your school’s total population