Download
1 / 35
350 likes | 592 Views
I: Human genome maps and localization of disease genes. Loengud ja seminarimaterjal: www.tymri.ut.ee -> õppetöö User: ML2004 Pw: 2004 Kirjandus: T. Strachan and A.P.Read “Human Molecular genetics” A. J.F. Griffiths et al “ Introduction in genetic analysis”

E N D
I: Human genome maps and localization of disease genes
Loengud ja seminarimaterjal: www.tymri.ut.ee -> õppetöö User: ML2004 Pw: 2004 Kirjandus: T. Strachan and A.P.Read “Human Molecular genetics” A. J.F. Griffiths et al “ Introduction in genetic analysis” Alberts B et al “Molecular Biology of the cell” http://www.ncbi.nlm.nih.gov:80/entrez/query.fcgi?db=Books
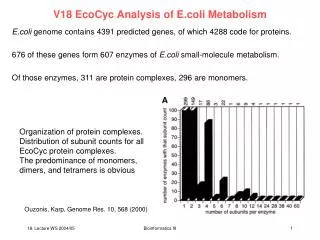
CLONES DISEASES Chromosomal Abnormalities cDNA Genomic Families Full- length Large insert STSs Heterogeneity Irregular inheritance ESTs Polymorphic FISH Somatic cell hybrids Radiation hybrids Multipoint Linkage (CEPH, etc.) Two-point linakge (Lods, sib pairs, Homozygosoty) Contig assembly Marker-marker framework map Initial disease Gene localization PHYSICAL MAP GENETIC MAP MOUSE map HUMAN GENOME MAP Gene identification Sequencing
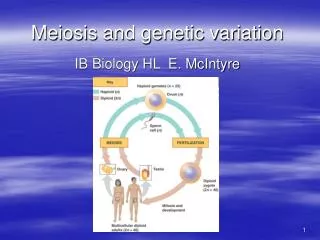
Genetic mapping - the aim is to discover how often 2 loci are separated by meiotic recombination Generation I A2A1 B2 B1 A2A2 B2 B2 A1 A1 B2 B1 A2 A1 B1 B1 II A2A1 B2B1 A1A1 B1B1 III A1A1 B1B1 A2A1 B2B1 A2A1 B1B1 A2A1 B2B1 A1A1 B1B1 A1A1 B2B1 A2A1 B2B1 NR NR R NR NR R NR Genes A and B with alleles A1, A2 and B1, B2 are segregating in the family
Recombination fractionbetween loci A and B: the proportion of children who are recombinant R; the probability that an odd number of crossover events will take place between two loci *Loci on different chromosomes: r (or q) =0.5 *Loci on the same chromosome or syntetic : r (or q) <0.5 *The closer the loci are, the smaller the value of R Genetic map unit is 1 cM (centimorgan) = 1% of recombination between two loci *The mathematical relationship between q and genetic map distance is described by mapping function (Haldane fucntion, Kosambi function) *average 49-55 crossovers per cell (differs between individuals) *chiasmata are more frequent in female meioses (fits Haldane rule that heterogametic sex has the lowere chiasma count) 1 female cM=1.68±1.07 Mb 1 male cM= 0.92±0.96Mb Sex-average cM= 1.30±0.80 Mb
Mapping of the genome requiresgenetic markers: any Mendelian character can be used as a marker *Genetic map preciseness and quality is increased by : 1) dense coverage of markers across genome 2) high PIC (polymorphism information content) 3) extensive family material - high number of informative meiosis A1 A1 A1A1 The father has a dominant condition that he inherited with the marker allele A1. Informative meiosis allows to define that the child inherited A1 from the father. A2A2 A1 A2 A1A2 A1A1 A1 A2 A1 A2 A1 A2 A3A4 A1 A2 A1A4 Uninformative meiosis Informative meiosis
The development of human genetic markers Marker When used No of loci Blood groups 1910-1960 ~20 Protein Electromorphs 1960-1975 ~30 HLA tissue types 1970 – 1 haplotype DNA RFLPs 1975 – <105 DNA minisatellites 1985 – <104 DNAmicrosatellites 1989 – <105 DNA SNPs 1998 – <106
Mendelian characters are determined by a SINGLE locus genotype *For human <10 000 Mendelian characters are known (OMIM database) *Character can be either dominant or recessive and is discrete (= Y or N) *Genotype can be either hetero-, homo- or hemizygous (male X and Y loci) *There are 5 [6]basic Mendelian pedigree patterns: - autosomal dominant inheritance - autosomal recessive inheritance - X-linked dominant inheritance - X-linked recessive inheritance - Y-linked inheritance [-mitochondrial or matrilinear inheritance] *The mode of inheritance is determined by using several pedigrees *knowledge of the mode of inheritance is the prerequisite for linkage analysis NON-Mendelian characters multifactorial: (1) continous or quantitative; (2) oligo- or polygenic; (3) environment-dependent expression
Linkage mappingof human disease genes– analysis of the segregation of marker alleles together with a Mendelian disease in human pedigrees Is based on counting recombinant and nonrecombinants *Usually is not possible to score the recombinants by hand *computerized lod score analysis is used likelihood that the loci are linked (with q) likelihood that the loci are unlinked (q=0.5) Odds of linkage= Lod score = log10(Odds of linkage) *lod scores are calculated over the range of q values *the most likely q is the one with the highest lod score *lod scored can be added up across families Z=3 is the threshhold of accepting linkage (= 1000:1 odds) Z<-2 linkage can be rejected (=1:10 odds)
Problems of lod score analysis in humans: *long generation time *inability to control matings *inability to control environmental exposure *errors in genotyping and misdiagnosis *computational difficulties *locus heterogeneity *limited resolution of the map *lod score mapping is limited to Mendelian characters
Types of physical maps available for human genome Types of Maps Features Resolution 1. Cytogenetic Chromosome Banding maps Several Mb 2.Chromosome a) Somatic cell hybrid panels Several Mb Breakpoint mapsb)Radiation hybrids maps >0.5 Mb 3. Restriction map Rare-cutter (e.g. Not-I) maps <0.5 Mb 4. Clone contig map a) overlapping YAC clones 0.1-1Mb b) overlapping cosmid clones ~40 kb 5. STS-maps typed by PCR; requires prior ~100 kb sequence information for PCR primers 6. EST-maps sequencing 200-300 bp from ~40 kb a cDNA clone, mapping back to other maps 7. DNA sequence map 1kb
Principle of theRadiation Hybrid Panelmapping Different radiation hybrid cell lines Localization of the mapped gene The mapping function D is measured in centiRays (cR) *Mapping is by PCR typing or Southern blot hybridization of the studied gene *The higher the initial radiation dose, the higher resolution mapping
Clone contig maps: contig=contigous DNA without any gaps across the whole chromosome or selected genomic region Clone (cosmid, BAC, PAC, YAC) Overlap between the clones can be detected using STSs content mapping, repetitive DNA fingerprinting (long insert clones like YACs) or RFLP, microsatellite typing, and FISH analysis (shorter insert clones like cosmids or PACs)
STS and EST STS- sequence tagged-site „foot-print“ of a genomic region: short DNA stretches, amplifiable by a defined unique pair of primers Applied for: cchracterization and mapping of genomic clones into the context of the particular genomic region or contig EST - expressed sequence tag Source: various cDNA libraries Method:1) cDNAs from a library are cloned into vectors; 2) 200-300 bp of each of cDNAs are sequenced random; 3) a public EST-database is formed, where scientists can identify and derive the clones containing the cDNAs of interest; 4) EST Initiative usually also tries maps the ESTs to the genome map
Publicly available genome databases NCBI: http://www.ncbi.nlm.hih.gov/ ENSEMBL: http://www.ensembl.org/ Organisms: human, mouse, rat, fruitfly, zebrafish, C.elegans, etc. Information: 1) genome maps – genetic, physical 2) coding sequence (transcript maps, ESTs etc.) 3) marker databases and maps (SNPs, mikrosatellites, RFLPs etc.) 4) Gene information (genomic structure, mRNA, peptide, gene family, polymorphisms, function, diseases, etc.) 5) polymorphism information 6) homology maps (e.g. Mouse and Human) 7) links to other databases (PubMed, OMIM, SNP databases, clone availability etc.)
Identification of disease genes: position-independent strategies Functional cloning Knowledge of the defective protein product Identification of a gene through its normal funtion Gene specific Oligonucleotides (Aspartylglucose Aminuria, AGU in Finns and AGA locus ) Use of specific Antibodies (Phenylketonuria And phenylalanine Hydrpxylase, PAH) Functional „rescue“ in cell lines or /transgenic mice (Fanconi’s anemia Group C) Substraction Cloning (Dystrophin and DMD gene)
Identification of disease genes: position-dependent strategies Step 1. Positional cloning Define the candidate Region Chromosomal aberrations in patients Linkage mapping High-resolution Map of the candidate region Polymorphism screening Genetic and physical mapping Linkage disequilibrium mapping Search for transcripts Search the databases Candidate gene search and analysis
Application of chromosomal Aberrations for mapping the disease locus: 3 individuals among the Finnish AGU (aspartyl- glucoseaminuria) patients were characterized by aberrant karyotype and simultaneously either under- (patients a,b) or over- (patient c) expression of the AGA protein. Patients a and b missed one telomeric segment of chr. 4q, patient c had an extra copy of this Region translocated to chr.21p. Thus, the AGA gene could Be mapped 4q33->tel
Step 2. Positional candidate cloning Homology to relevant Human gene or EST Define the candidate gene (s) Expression pattern And function Homology to a relevant Gene in a model organism Confirming a candidate gene Mouse model of the disease Mutation screening Restoration of Normal phenotype Difficulties: *Locus heterogneity *mutational homogeneity *neutral versus pathogenic mutations *other types of mutation than SNPs Understand the function of the gene
Given the current size of world’s population, the human genome is LESS diverse than might be expected: Recent divergence from other primates Relatively small size of human population over most of its history Major waves of human migrations: 100 000 years ago out of Africa 50 000 - 30 000 to new regions, as Americas and Australia 10 000 ya with spread of agriculture after the last glacial period.
Genetic consequences of a bottleneck accompanied by isolation: *Less diversity *Inbreeding *Genetic drift - random enrichment of recessive and neutral alleles bottleneck Population genetic diversity before bottleneck Population genetic diversity after bottleneck time
Use of population isolates for mapping human traits Peltonen et al., 2000
I. Examples of exploited isolated populations with High frequency of certain Mendelian disorders : *Finns, Amish, Sardinians, Bedouins II for mapping complex diseases, it might be useful to study very young isolates (10-20 generations): *eastern Finland (Kuusamo), Costa Rica, Quebec, Newfoundland These population isolates are have: Reduced genetic complexity Uniform environmental and cultural feature in the isolate
16th century Two waves of settlement by founder effect: >30 Finnish Mendelian diseases Peltonen et al., 2000 2000-4000 years ago
Population isolates have been used with great success for identifying single gene defects. Linkage analysis needs: reliable diagnosis; (b) pattern of inheritance Due to founder effect and genetic drift, the “disease allele chromosomes” possess strong haplotype signatures: The younger the mutation and the lower the recombination rate, the longer the “disease” haplotype around the mutation
“disease” chromosome P M P P P Novel mutation (M) is in absolute allelic association with certain haplotypic pattern of all polymorphic markers (P ) of the same chromosome Other chromosomes in populations with random distribution of alleles at loci P Present chromo-somes Recombinations in population history
Simple versus Complex disease mapping: are the isolates also here useful? In practise, most successes in mapping complex disease loci in population isolates have depended on large pedigrees with proven or predicted genealogical ties between affected individuals. Other strategies - genome scans to monitor intrafamilial association and linkage disequilibrium in population isolates have been less successful Important! Subdivision of patient populations by qualitative clinical criteria minimizes genetic heterogeneity
Icelandic experiment: *Iceland was founded 9th-10th century by limited numbers of founders from Scandinavia *minimal immigration during 1100 years *most of 275 000 Icelanders are descendents of original settlers *A tradition of recording family trees - genealogy of Icelanders traces back >1000 years *reduced genetic heterogeneity due to founder effect and inbreeding *deCODE project: cross-populations databases of linked genealogical, patients and genotyping records
vLINCL 1 Example of the mapping strategy of a Mendelian disease gene In population isolate :vLINCL NCL( neuronal ceroid lipofuscinosis) - a group of neurodegenerative Disorders of childhood with an incidence of 1:12 500 births vLINCL(Finnish variant for late infantile NCL) affects children at the age 4-7 yo. with first symptoms of clumsiness, followed by progressive visual failure, mental and motor deterioration Enriched in Southern Ostrobothnia region of Finland Most Finnish patients probably share a mutation, which was introduced 20-30 generations ago (500-750 ya), i.e. during the period of inner migration In Finland from coast to the inland. Mutation was spread and clustered in the area probably due to low number of the founders, followed by demographic expansion and relatively strong isolation
vLINCL 2 Linkage with polymorphic markersD13D160 and D13S162 at chromosome 13q : critical region 4 cM II.Physical map Across the region using FISH-methods: III.New polymorphic markers I.Clones: previously Available and isolated During the project 2. LD mapping: Haplotype analysis 1. Genetic mapping 1. Refined chromo- Somal region 13q32 2. Exclusion of Candidate genes By position Narrowed down critical region 200 kb IV.Identification of novel candidate genes by the searches in EST database and cDNA library screening 3. Contig across critical region cDNA clone assambly for putative CLN5 gene:ESTs, RACE, library cDNAs Disease mutation identification in patients versus controls RNA expression pattern by Northern and RT-PCR Tissue expression analysis: mutation verification and disease pathology study
vLINCL 3 Physical mapping of vLINCL candidate region by FISH on metaphase chromosomes, mechanically streched chromosomes and DNA fibers
vLINCL 4 CLN5 gene: putative transmembrane protein with no homology to previously reported genes (Savukoski et al., 1998) 3 different haplotypic backgrounds with 3 different mutations: 1) a 2 -bp deletion in exon 4 (FinMajor), in the highest risk area with the carrier frequency 1:24, in en extended high-risk area 1:100, not present elswere in Finland 2) a nonsense mutation (FinMinor) - transversion in exon 1, present in only one family, not present elsewere in Finland nor Europe 3) a missense mutation (Dutch mutation) -transversion in exon 4 CLN5 gene: lysosomally targeted glycoprotein(Isosomppi et al., 2002) 1) expressed in embryonic human brain at the beginning of cortical neurogenesis 2) transfection experiments: WT is lysosomally targeted and partially secreted into culture medium 3) transient localization in ER and Golgi reflects intracellular traffiking of CLN5 to lysosomes 4) CLN5 is N-glycosylated ->soluble protein 5) FINMajor mutation -> protein expressed but not targeted to lysosomes