Download
1 / 53
610 likes | 1.21k Views
Evidence-based public health in action: The Global Burden of Disease study. Nigel Bruce - Department of Public Health and Policy University of Liverpool. Outline of session. Overview of Global Burden of Disease studies Methods for disease burden and comparative risk assessment (CRA)

E N D
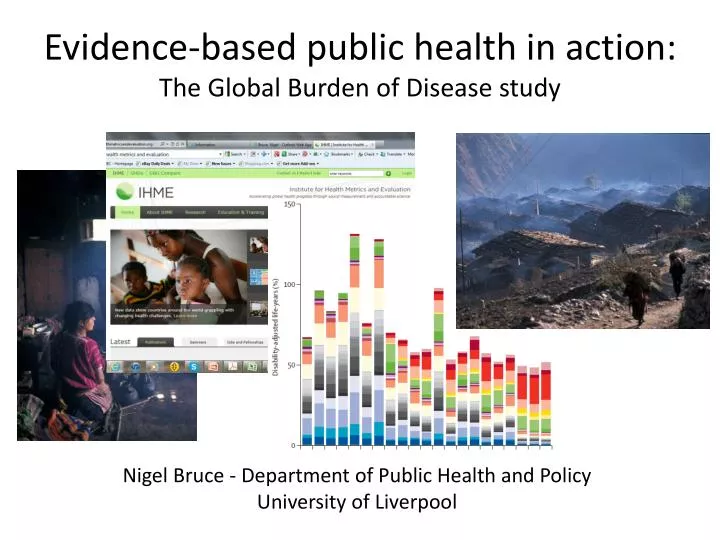
Evidence-based public health in action:The Global Burden of Disease study Nigel Bruce - Department of Public Health and Policy University of Liverpool
Outline of session • Overview of Global Burden of Disease studies • Methods for disease burden and comparative risk assessment (CRA) • Evidence inputs (generic) • Some of outputs and how these are displayed • Evidence in more detail: example of the CRA for household air pollution (HAP) • Discussion – ask anytime!
Key finding Are they right?
Strengths and limitations Murray CJL et al. UK health performance: findings of the Global Burden of Disease Study 2010.,The Lancet, March 5, 2013. (20 countries: UK vs. EU15; USA, Canada, Norway, Australia) • Key strengths: • Standardised methods allow comparisons • Global, regional and national analysis • Limitations: • Many assumptions • Missing components • Applications: • Prioritising diseases and control programmes • Increasing attention to risk factors Age-specific mortality rank 1990-2010 (females) 2010 1990
Methods (1): two main components 2. Comparative risk assessment 1. Burden of diseases DALYs Population Exposure levels Risk estimates Mortality (YLL) Morbidity (YLD) Envelope
Disability-adjusted life years (DALYs) Ideal life expectancy at birth: 86 years (lowest observed death rate - Japan) http://en.wikipedia.org/wiki/
Years of life lost (YLLs) YLL = N x (L - X) N = Number of deaths in the population L = Standard life expectancy at age of death X = Age of death • Example: • 1 death at age 50: = 1 x (86*- 50) YLLs = 36 YLLs • 3 deaths at 50: = 3 x 36 YLLs = 108 YLL * Simplification for teaching purposes: life expectancy varies by age, e.g.86 years at birth, 37 years at age 50, 11 years at age 80, 2 years at age 100.
Years of life lived with disability (YLDs) YLD = I x DW x d I = Number of incident cases in the population DW = Disability weight d = Duration of disability [years] • Examples: • 1 case of moderate intellectual disability at birth (assuming normal life expectancy) = 1 case/year x 0.080 x 86 years = 7 YLDs • 3 cases of moderate intellectual disability at birth = 3 cases/year x 0.080 x 86 years = 21 YLD
Disability weights: health state valuationsGBD 2010 study • Societal preferences for 220 different health states: • Departures from perfect health • 0 = perfect • 1 = death • Valuation carried out by: • Household surveys in 5 countries (n=13,903 participants) • Open access web-based survey (n=16,328) Eight core function domains of health • Mobility • Self-care • Pain and comfort • Cognition • Interpersonal activities • Vision • Sleep and energy • Affect
Disability weights: examples Salomon et al (2012)
Calculation of DALYs DALY = YLL + YLD • years of life lost because of premature death (YLLs) • years of life lost due to life with disability (YLDs) 1 DALY = 1 lost year of healthy life • Examples (assuming ideal life expectancy of 86 years): • 1 child death from pneumonia at age 2 years = 84 DALYs (all due to YLL) • 1 case of cancer diagnosed at age 70, survived with treatment for 6 years (disability weight = 0.30), died at age 76: • 6 YLD x 0.3 (weight) = 1.8 DALYs • 10 YLL = 10 DALYs Total = 11.8 DALYs
Information sources for mortality and morbidity • Refer to Lancet papers! • Mortality: • Developed countries have good vital registration systems (but not perfect) • Developing countries: multiple sources of data used • Morbidity: • Problematic everywhere • Multiple data sources • Use of DISMOD-MR (Bayesian meta-regression)
Example of GBD 2010 study • DALYs stable (2,500 million) 1990 – 2010 • % YLL reduced • % YLD increased BBC website headline ... 1990 2010
Methods (2): CRA • Proportion of population exposure to the risk factor • Counterfactual: ideal level of risk factor • Risk of (causally linked) health outcomes from exposure to the risk factor (RR) • Population attributable fraction – PAF (1-3) • Total burden of linked diseases (deaths; DALYs) • Attributable burden = PAF x (5)
1/2 - Exposure & counterfactuals:(examples for illustration only) Continuous: e.g. BMI Categorical: e.g. smoking % population Counterfactual: TMRED* 21-23 kg/m3 Existing distribution *TMRED: Theoretical-minimum-risk exposure distribution 20 25 30
3 - Outcomes and risk estimates • Systematic review • Meta-analysis • Supporting evidence: • Analogous exposure • Animal • mechanisms • Strength of evidence for causal association
Association vs. CausationBradford-Hill viewpoints (not criteria!)
Association vs. CausationBradford-Hill viewpoints (not criteria!) *But beware of the highly statistically significant finding! (p<0.0001 ≠ strong risk)
4 - Population attributable fraction (PAF) • The PAF indicates the proportion of cases that would not occur if the factor were eliminated • Depends on: • Prevalence of the risk factor • Strength of (causal) association with disease outcome (relative risk = RR) • PAF = Pe (RRe-1) / [1 + Pe (RRe-1)] • Peis the prevalence of the exposure (e.g., proportion who smoke; proportion using solid fuels for cooking, etc.) • RRe is the relative risk of disease due to that exposure.
Methods (2): CRA • Proportion of population exposure to the risk factor • Counterfactual: ideal level of risk factor • Risk of (causally linked) health outcomes from exposure to the risk factor (RR) • Population attributable fraction – PAF (1-3) • Total burden of linked diseases (deaths; DALYs) • Attributable burden = PAF x (5)
Example from GBD 2010 (CRA) DALYs for Men: #1 is tobacco smoking (including SHS) Cancer UG COPD ARI TB CVD
On-line graphics http://www.healthmetricsandevaluation.org/gbd/visualizations/regional
Summary so far … • Now ready to look in more detail at how this is done in practice for a risk factor • Devil in detail! • Any questions before we break?
Comparative Risk Assessment (1990-2010)Household air pollution
Recap of evidence needed for HAP Counterfactual Exposure Outcomes and RRs Total burden for linked diseases
1 - Exposure to HAP • Around 3 billion still cook with ‘solid fuels’ • Cocktail of health damaging pollutants • PM2.5 single best measure, but: • Ad hoc, not population studies • Rely on nationally representative surveys of ‘primary cooking fuel’ • WHO Household energy database • Solid fuel • Wood • Dung • Crop wastes • Charcoal • Coal
41% of households (95% CI: 37, 44) % SFU closely associated with poverty and health indicators
Global and regional trends:solid fuel as primary cooking fuel Total population affected steady at 2.8 billion
2 - Counterfactual • Prior CRA: • Used ‘not cooking with solid fuel’ • GBD 2010: • What is the concentration of PM2.5 with no risk of adverse health consequences? • Annual WHO AQG for PM2.5 = 10 µg/m3 • Studies (e.g. CVD) detect risk down to lower levels • Theoretical-Minimum-Risk exposure distribution (TMRED) • Centred around 7.5 µg/m3
HAP distribution and counterfactual (for illustration only) % population This TMRED used for outcomes where E-R functions available. For others (e.g. Cataract, COPD), use of non-solid fuel was the counterfactual. Counterfactual: TMRED (5.5 – 8.8 µg/m3) Existing distribution 1000 20 100 500 PM2.5 µg/m3
Lung cancer with exposure to biomass (wood, dung, crop wastes, charcoal) smoke • IARC Monograph (2010): • Coal: group 1 carcinogen • Biomass: Group 2(a) ‘Probable carcinogen’ • IARC concluded for biomass: • Epidemiological evidence was limited • Animal evidence was sufficient • Mutagenicity evidence was strong • Carcinogens: • PAH • Benzene • Formaldehyde
Systematic review (2013) • 14 studies (25 estimates) • Men: OR=1.17 (1.05, 1.31) [I2=0%] • Women: OR=1.20 (0.97, 1.49) [I2=49%] • Combined: OR=1.18 (1.03, 1.35) [I2=40%]
Publication bias Begg’s: p=0.48 Egger’s: p=0.61
Sensitivity analysis (men) • Quality assessment of studies identified: • Some with inadequate adjustment • Some with comparison groups that were not ‘clean fuel’ (or too poorly described) • Sensitivity analysis excluded such studies (FE)
Sensitivity analysis (women) 1All results in this sensitivity analysis are women only, who can be expected to smoke less than men 2Exclusion of one study with kerosene in the clean fuel group
Sensitivity analysis (women) 1All results in this sensitivity analysis are women only, who can be expected to smoke less than men 2Exclusion of one study with kerosene in the clean fuel group
Jigsaw completed! Counterfactual Exposure Attributable disease burden Outcomes and RRs Total burden for linked diseases
Global BoD (2010): HAP DALYs (Women) Cataract ALRI Cancer COPD CVD
DALYs HAP: 1990-2010 Reduction mainly driven by rapid fall in mortality for child ALRI (reduces YLL) Ranks based on global DALYs (all ages, all sexes) for top 10 risk factors
Ranking by region – ‘Heat maps’:HAP 1st in S Asia; 2nd in S/S AFRICA; 3rd in SE Asia
Estimating uncertainty:(illustrated – risk factors ranked by global DALYs, 2010) • Simulation analysis • 1000 draws from distributions of (a) exposure (b) RR (c) outcomes • Each age, sex, country, year • 95% UIs: 2.5th and 97.5th percentiles of 1000 draws HAP (4th)
Other household fuel-related outcomes Not included: Burns • 338,000 deaths per year (GBD 2010) • Many more severe injuries • >90% of deaths occur in LMICs • We lack good population and risk data, so … • … not included in CRA (due to HH energy use)
Some conclusions and reflections • Importance and opportunities for EBPH: • Important and influential • HAP results increasing attention to policy on access to clean households energy • Disaggregation: national (will be) available; sub-national ...? • Methods: • Standardised ( as much as possible?) across causes and risks • SR/MA a critical aspect of methods; careful assessment of study methods and quality is vital! • Limitations of data and gaps; for environmental risks - heavy reliance on observational epidemiology • Most complete uncertainty estimates for GBD to date • Methods evolving; strong reliance on modelling for mortality (developing countries), and especially for morbidity and exposure • Discussion
One further devil ... • Systematic review based on observational studies • HAP and exposure not measured • Estimated from studies measuring HAP: • ‘Exposed’: around 300 µg/m3 for women (200 for men) • ‘Unexposed’: 70 µg/m3 (45 for men) • But ... TMRED is centred on 7.5 µg/m3 • Effect ...? • Able to use exposure-response functions (IERs) • But need estimates of population exposure
Generating population exposure estimates:Model based on Indian data – used globally • Studies in 4 states: • HAP measurements • Household variables • National model: • By state • NFHS data to predict HAP concentrations PM2.5 (µg/m3) and 95% CI
‘Integrated exposure response’ (IER) functions 95% CI around OR estimate (F) Lung cancer • Integrates evidence from OAP, SHS, HAP and active smoking • For CVD, Stroke, COPD, Ca lung and child ALRI • Shown here: RR for HAP over exposure contrast Exposure range (F)