Download
1 / 18
180 likes | 331 Views
3D Sensor Characterization, Electrode Capacitance Measurements. Martin Hoeferkamp , Sally Seidel, Igor Gorelov University of New Mexico 8 th RD50 Workshop, Prague 27 June 2006. Introduction.

E N D
3D Sensor Characterization,Electrode Capacitance Measurements Martin Hoeferkamp, Sally Seidel, Igor Gorelov University of New Mexico 8th RD50 Workshop, Prague 27 June 2006
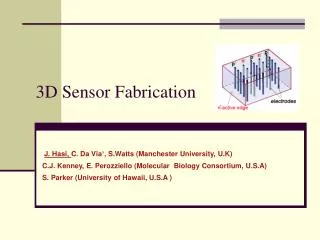
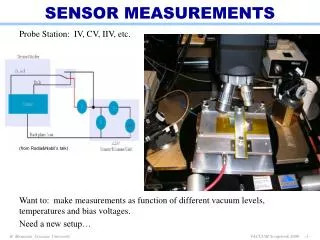
Introduction • Motivation: a need for 3D sensors to have an electrode capacitance compatible in value with existing front end chip requirements. • Eg. , ATLAS Pixel detector upgrade, 3D sensors on TOTEM experiment will use ATLAS front end chip. • Measured values on the order of 100fF, difficult with LCR meter • An alternative method of capacitance measurement is presented. • 3D sensors received from Sherwood Parker (Hawaii U.) and Chris Kenney (Stanford U.) include: - non-irradiated sensor - irradiated 3D sensors • 2x1014 cm-2 55 MeV proton • 1x1015 cm-2 55 MeV proton
3D Sensor Configuration • Configuration of Measured Devices • Alternating columns of n- and p-electrodes • Most electrodes are connected together along each column • Some electrodes are left isolated, to be contacted and measured individually • Layout dimensions ( not same as ATLAS pixel) • Top view layout
Electrode Capacitance, direct meas. • Direct Measurement uses standard CV measurement with LCR meter (HP4284A) • Non-irradiated: N Electrode • Irrad 1015 55MeVp: N Electrode • Irrad 2x10¹⁴ 55MeVp: N Electrode Result: very low electrode capacitance Cnon-irrad N ~ 59fF(10KHz), 38fF(100KHz), 32fF(1MHz) Cirrad 2x10¹⁴ N ~ 72fF(10KHz), 72fF(100KHz), 62fF(1MHz) Cirrad 1x10¹⁵ N ~ 91fF(10KHz), 80fF(100KHz), 60fF(1MHz)
Electrode Capacitance, direct meas. • Direct Measurement using LCR meter (HP4284A) • Non-irradiated: P Electrode • Irradiated 1015 55MeVp: P Electrode • Irradiated 2x10¹⁴ 55MeVp: P Electrode Result: very low electrode capacitance Cnon-irrad P ~ 71fF(10KHz), 58fF(100KHz), 46fF(1MHz) Cirrad 2x10¹⁴ P ~ 96fF(10KHz), 69fF(100KHz), 53fF(1MHz) Cirrad 1x10¹⁵ P ~ 98fF(10KHz), 70fF(100KHz), 55fF(1MHz)
Electrode Capacitance, direct meas. • Direct Measurement using LCR meter (HP4284A) • Non-irradiated: N Electrode Result: electrode capacitance decreases with lower temperature, and reaches a minimum value at ~ -10oC.
Electrode Capacitance, direct meas. • Dependence of CV characteristics on measurement frequency • The frequency dependence is observed at every temperature. • Frequency dependence of irradiated sensors is due to the finite reaction time of the deep traps which respond better to lower frequency signals (Lancaster U.). • The capacitances are higher for more heavily irradiated sensors • There is a temperature dependence of the capacitance at a fixed measurement frequency. • Capacitance depends on the frequency and the temperature, same as for planar sensors.
Electrode Capacitance, indirect meas. • Indirect Measurement using Decay Time of IR pulse on an isolated electrode. • Electrode is grounded through input impedance of a Picoprobe 35. • The IR laser induced charge is collected, rising signal on measured pulse. • When the laser is turned off the signal decay follows an exponential with a time constant = R*(C+C3D) , referred to here as RC time constant. • C3D is extracted from the decay time constant using values of probe resistance and capacitance. Pulsed1064nm IR Laser +Vbias Gnd PICOPROBE 35 To Oscilloscope R= 1.25M C=.05pF
Electrode Capacitance, indirect meas. Fast Pulser Focused Laser 1064nm Oscilloscope PICOPROBE 35 Vbias R= 1.25M C=.05pF Thermal Chuck • Laser: 1064 nm EG&G • Probes: Picoprobe 35 26GHz BW, Cascade Microtech coaxial • Oscilloscope: Tektronix TDS7254 2.5Ghz BW • Thermal Chuck: Micromanipulator (-60oC )
Electrode Capacitance, indirect meas. • Indirect Measurement using Decay Time Picoprobe 35 signal, Non-irradiated p-electrode • RC Time Const = R*(C+C3d)= 169nS • C3D = 85fF
Electrode Capacitance, indirect meas. • Indirect Measurement using Decay Time of signal on Picoprobe, • Non-irradiated p-electrode • Average RC time constant is 169nS, p-electrode capacitance is 85fF
Electrode Capacitance, indirect meas. • Indirect Measurement using Decay Time of signal on Picoprobe 35, Irradiated sensor p-electrode * On irradiated sensors there is a long tail at longer times which may be due to release of charge from traps produced by irradiation. • Assuming a single dominant trapping time constant t: V = [Vo-Vto(RC/t-RC)]e-t/RC + Vto(RC/t-RC)]e-t/t (Ref: S. Parker and C. Kenney, IEEE Trans. Nuc. Sci. ,Vol. 48, No. 5, Oct. 2001)
Electrode Capacitance, indirect meas. • Indirect Measurement using Decay Time of signal on Picoprobe 35, Irradiated sensor p-electrode Time Const=R*(C+C3d)=177nS,C3D=91.6fF Second time const = 273nS
Electrode Capacitance, indirect meas. • Indirect Measurement using Decay Time of signal on Picoprobe • Irradiated 2x1014 cm-2 55MeVp sensor p-electrode • Average RC time constant is 177nS, p-electrode capacitance is 91.6fF • Second (trapping?) time constant t is 273nS
Electrode Capacitance, indirect meas. • Indirect Measurement using Decay Time of signal on Picoprobe • Irradiated 1x1015 cm-2 55MeVp sensor p-electrode • Average RC time constant is 247nS, p-electrode capacitance is 147fF • Second (trapping?) time constant t is 373nS
n n p p p n n Electrode Capacitance, calculation • 3D Electrostatic Calculation (IES Coulomb): • P Electrode Length = 120 um • P Electrode Diameter = 20 um • Center electrode to nearest neighbors Result: 3D calculation C3D P electrode = 31fF Note: result verified by S. Watts (Brunel U.) using an alternative calculation.
Comparison of Results • Summary: Indirect measurement gives similar results to 10KHz LCR meter result
Summary • Two methods for measuring 3D sensor capacitance and results are presented. • In general the indirect method gives similar results to the direct method with the LCR meter frequency of 10KHz. This is also consistent with the RD50 guideline of 10KHz LCR measurements. • 3D sensor Electrode Capacitance depends on frequency of the LCR meter and on the sensor temperature, same as for planar sensors. • Need to further investigate possibility of extracting the trapping time constant from the second time constant of the irradiated sensors.