Download
1 / 23
230 likes | 514 Views
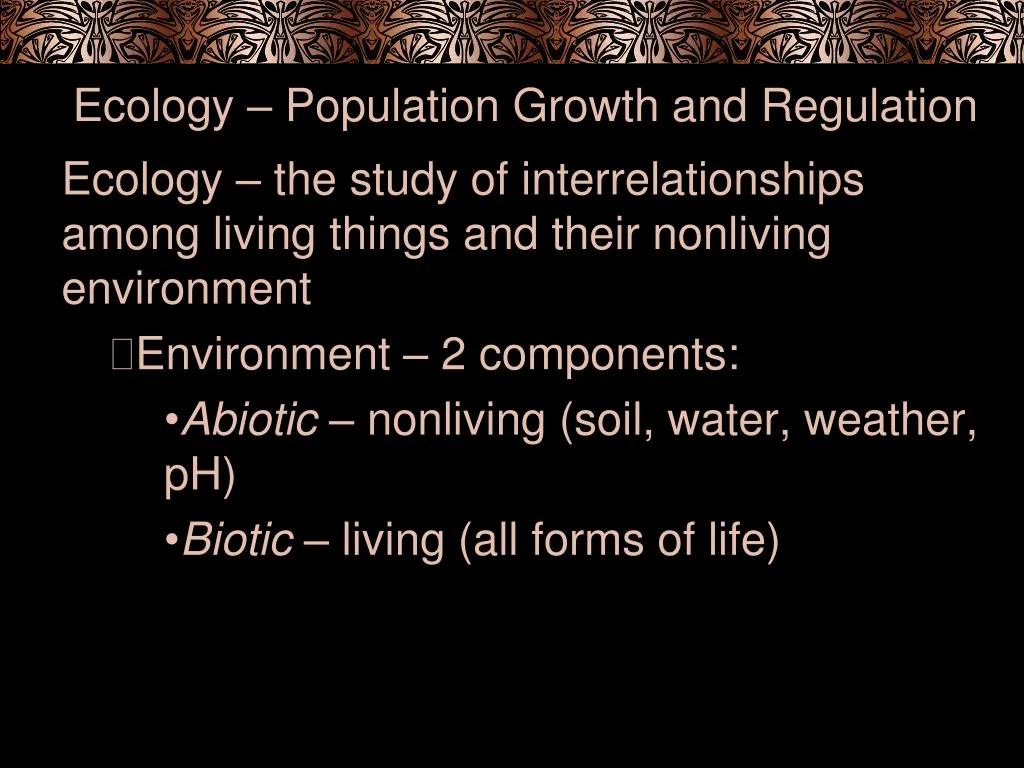
Ecology – Population Growth and Regulation. Ecology – the study of interrelationships among living things and their nonliving environment Environment – 2 components: Abiotic – nonliving (soil, water, weather, pH) Biotic – living (all forms of life). Levels of Organization:

E N D
Ecology – Population Growth and Regulation Ecology – the study of interrelationships among living things and their nonliving environment Environment – 2 components: Abiotic – nonliving (soil, water, weather, pH) Biotic – living (all forms of life)
Levels of Organization: Population – all members of a particular species who live within an ecosystem, interact with one another and can potentially interbreed Community – all the interacting populations in an ecosystem Ecosystem – all the organisms and their nonliving environment within a defined area (prairie, forest) Biosphere – the part of the earth inhabited by living organisms; includes both living and nonliving components
Populations • Population density – number of individuals/unit area • Measuring density • In rare cases, population size and density can be determined by counting the actual number of organisms • Usually done by random sampling • Common method used is the mark-recapture method (read in textbook)
Population distribution – the spatial pattern in which members of a population are dispersed within a given area Clumped – members of a population live in groups (herds, flocks, schools) Advantage includes more individuals to find food, large groups confuse predators May clump due to resource availability (cotton trees cluster along streams, animals around water holes) Uniform – organisms maintain a relatively constant distance between individuals Common in animals that are territorial Helps ensure adequate resources for each individual Random – patternless and unpredictable, occurs in the absence of strong attractions or repulsions among individuals, resources equally available (more rare) ex. Trees and plants in rainforest
Clumped dispersion Uniform dispersion Random dispersion Dispersion Patterns
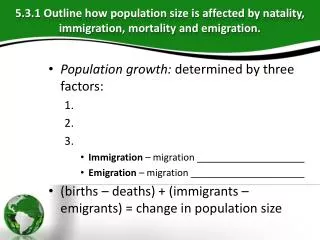
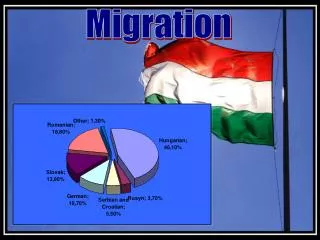
Population growth – determined by three factors: births, deaths, and migration (immigration – migration into a population; emigration – migration out of a population) (births – deaths) + (immigrants – emigrants) = change in population size Ultimate size of a population results from a balance between opposing factors: Biotic potential – maximum rate at which the population could increase, assuming ideal conditions that allow a maximum birth rate and minimum death rate Environmental resistance – limits set by the environment such as availability of food, space, competition, predation, and parasitism
Biotic Potential • Growth rate (r) – measure of the change in population size per individual per unit of time b - d = r (birth rate) (death rate) (growth rate) • To determine number of individuals added to a population in a given time period, growth rate (r) is multiplied by original population size (N) population growth = rN
Biotic Potential • Exponential growth – pattern of continuously accelerating increase in population size – forms a J-curve • Example: bacteria under ideal lab conditions could produce enough bacteria to form a foot deep layer over the entire Earth starting with just one cell dividing every 20 min.
Biotic potential is influenced by: Age at which the organism first reproduces Frequency with which reproduction occurs Average number of offspring produced each time Length of organism’s reproductive life span Death rate of individuals under ideal conditions Biotic potential helps ensure that at least one offspring survives to bear it’s own young In nature, exponential growth occurs only for a limited time
Regulation of Population Growth • Population size is limited by environmental resistance (such as available resources) • Boom-and-Bust cycles – populations characterized by rapid growth followed by a sudden massive die-off ex. Algae, insects – have seasonal cycles linked to rainfall, temperature, nutrient availability Insects grow during spring and summer and die with the frost
S-curves – after a period of growth, populations tend to stabilize at or below the max number the environment can sustain Reaches a state of equilibrium with growth rate of zero Carrying capacity – max population size that an ecosystem can support indefinitely Typical of long-lived organisms
Limiting Factors – 2 Major Types • Density independent – limit size of population regardless of population density • Weather (causes boom and bust cycles), human activity (pesticides, pollution, habitat destruction), natural catastrophes (flood, fire, hurricane)
Density dependent – limit size of population as population density increases Major limiting factor for long-lived species Examples include: predation and parasitism – control prey/host populations Competition for limited resources Intraspecific competition – among individuals of the same species (very intense, impt in natural selection) Interspecific competition – among individuals of different species Usually, if two species niches overlap too much, will lead to Competitive Exclusion • Overcrowding may lead to physiological and behavioral changes that increase emigration
Competitive Exclusion Principle • Proposed by G.F. Gause (Gause’s Principle) • If two species niches overlap too much, one species will be better at getting the resources and the other will be eliminated
Mortality and Survivorship Curves • Populations show characteristics patterns of deaths or survivorship over time 1. Late Loss – show a convex shaped curve, relatively low infant death rates, most individuals survive to old age Red curve Ex. Humans, large animals
Mortality and Survivorship Curves 2. Constant Loss – individuals have a fairly constant death rate, have an equal chance of dying at any time during their life span Black line Ex. annual plants, hydra, some invertebrates, some rodents
Mortality and Survivorship Curves 3. Early Loss – show a concave curve, produce large numbers of offspring that receive little parental care, death rate is very high among offspring, those that become adults have a good chance of surviving to old age Blue curve Ex. Most invertebrates, plants, many fish
Life History • Traits that affect an organism’s schedule of reproduction and death • K- selected populations (species or strategists) and r-selected populations (species or strategists) represent hypothetical models
r-selected populations • Usually do not reach carrying capacity • Tend to live in unstable, temporary environments • Generally limited by density independent factors • Produce large numbers of offspring • Early loss survivorship curve
K-selected populations • Usually have slow or no population growth • Usually at or near carrying capacity • Live in stable predictable environments • Produce few young and provide parental care • Competition for limited resources limits population size • Late loss survivorship curve