Download
1 / 33
330 likes | 337 Views
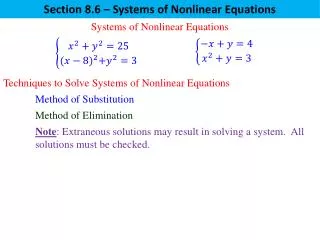
Section 8.6. Testing a Claim About Standard Deviation or Variance. Objective. Chi-square distribution review Introduce the test statistics for testing the claim about a population standard deviation or population variance

E N D
Section 8.6 Testing a Claim About Standard Deviation or Variance
Objective • Chi-square distribution review • Introduce the test statistics for testing the claim about a population standard deviation or population variance • Introduces methods for testing a claim made about a population standard deviation σ or population variance σ2.
Objective • After this lesson, the student will be able to • Accurately calculate Chi-square test statistic value; • Use the calculator to find the P-value for Chi-square distribution correctly; • Perform hypothesis testing for σ or σ2; • Interpret the test result completely.
Notations for Testing Claims About or 2 n= sample size s= sample standard deviation s2 = sample variance = claimed value of the population standard deviation 2 = claimed value of the population variance
Properties of Chi-Square Distribution Chi-Square Distribution for 10 and 20 df Properties of the Chi-Square Distribution Different distribution for each number of df. Figure 8-14 Figure 8-13
Chi-Square Distribution Test Statistic
P-Values and Critical Values for Chi-Square Distribution Use Table A-4 or graphing calculator. The degrees of freedom = n –1.
Example 1: Consider the simple random sample of the 37 weights of post-1983 pennies listed in Data Set 20 in Appendix B. Those 37 weights have a mean of 2.49910 g and a standard deviation of 0.01648 g. U.S. Mint specifications require that pennies be manufactured so that the mean weight is 2.500 g. A hypothesis test will verify that the sample appears to come from a population with a mean of 2.500 g as required, but use a 0.05 significance level to test the claim that the population of weights has a standard deviation less than the specification of 0.0230 g.
Example 1: Requirements are satisfied: simple random sample; and STATDISK generated the histogram and quantile plot - sample appears to come from a population having a normal distribution. Step 1: Requirement check is passed
Example 1: Step 2a: Express claim as < 0.0230 g Step 2b: If < 0.0230 g is false, then ≥ 0.0230 g Step 2c: < 0.0230 g does not contain equality so it is the alternative hypothesis; null hypothesis is = 0.0230 g H0: = 0.0230 g H1: < 0.0230 g Step 3: significance level is = 0.05 Step 4: Claim is about so use chi-square
Example 1: Step 4: The test statistic is Step 5: The P-value from calculator that corresponds to 36 degrees of freedom is 2 cdf (0, 18.483, 36) = 0.0069.
Example 1: Step 6: Because the test statistic is in the critical region, reject the null hypothesis. Step 7: There is sufficient evidence to support the claim that the standard deviation of weights is less than 0.0230 g. It appears that the variation is less than 0.0230 g as specified, so the manufacturing process is acceptable. Any Question?
Work Sheet Problem #1 A manufacturer of candy must monitor the temperature at which the candies are baked. Too much variation will cause inconsistency in the taste of the candy. Past records show that the standard deviation of the temperature has been 1.2 degrees Fahrenheit. A normally distributed random sample of 30 batches of candy is selected, and the sample standard deviation of the temperature is 2.1 degrees Fahrenheit. Use a 0.05 Significance Level to test the claim that the standard deviation has increased to above 1.2.
Work Sheet Problem #2 A market researcher for an automobile dealer intends to conduct a nationwide survey concerning car repairs. Among the questions included in the survey is the following: “What was the cost of all repairs performed on your car last year?” In order to determine the sample size necessary, the researcher needs to provide an estimate of the standard deviation. Using his past experience and judgment, he estimates that the standard deviation of the amount of repairs is $200. Suppose that a small-scale normally distributed study of 25 auto owners selected at random indicates a sample standard deviation of $237.52. At the 0.05 Significance Level, is there evidence that the population standard deviation is different from $200?
Problem (together) • A simple random sample regarding the birth weights of 16 male children whose mother were treated with a vitamin supplement is given in kg. as following: 3.73, 4.37, 3.73, 4.33, 3.39, 3.68, 4.68, 3.52, 3.02, 4.09, 2.47, 4.13, 4.47, 3.22, 3.43, 2.54 • Using a 0.05 significance level, test the claim that this vitamin supplement results in birth weights with a standard deviation equal to 0.470 kg, which is the standard deviation of all male birth weight.
The How To • Step 1:Check Requirements. • Simple random sample • The population is normally distributed • Histogram • Normal Quantile Plot
The How To • Step 4: Calculate the appropriate test statistic (only one) • 1 Var Stats • Sx = 0.65731
The How To Step 5: Determine the P-value (Use a Calculator) Two tailed test P-value = 2 ( 0.01454) = 0.02908
The How To • Step 7: State conclusion in simple non-technical terms • There is sufficient evidence to reject the claim that this vitamin supplement results in birth weights with a standard deviation equal to 0.470 kg.
Work Sheet Problem #3 The marketing manager of a branch office of a local telephone operating company wants to study characteristics of residential customers served by her office. In particular, she wants to estimate the mean monthly cost of calls within the local calling region. In order to determine the sample size necessary, she needs an estimate of the standard deviation. On the basis of her past experience and judgment, she estimates that the standard deviation is equal to $12. Suppose that a small-scale normally distributed study of 15 residential customers indicates a sample standard deviation of $9.25. At a 0.01 level of significance, is there evidence that the population standard deviation is different from $12?
Work Sheet Problem #4 A manufacturer of doorknobs has a production process that is designed to provide a doorknob with a target diameter of 2.5 inches. In the past, the standard deviation of the diameter has been 0.035 inch. In an effort to reduce the variation in the process, various studies have resulted in a redesigned process. A sample of 25 doorknobs produced under the new process indicates a normal distribution and a sample standard deviation of 0.025 inch. At the 0.05 level of significance, is there evidence that the population standard deviation is less than 0.035 inch in the new process?
Recap • In this section we have discussed: • Tests for claims about standard deviation and variance. • Test statistic. • Chi-square distribution. • Critical values. • P-value
Homework • P. 449 13, 17-19