Download
1 / 31
310 likes | 324 Views
IRISH GROCERY MARKET REVIEW. Period ending - 25 th Dec 2011. OVERVIEW. Market Overview The annual market sales are ahead of last year, with growth of +0.5% year-on-year. The food market is showing stronger growth (0.9% year on year) than the non-food market.

E N D
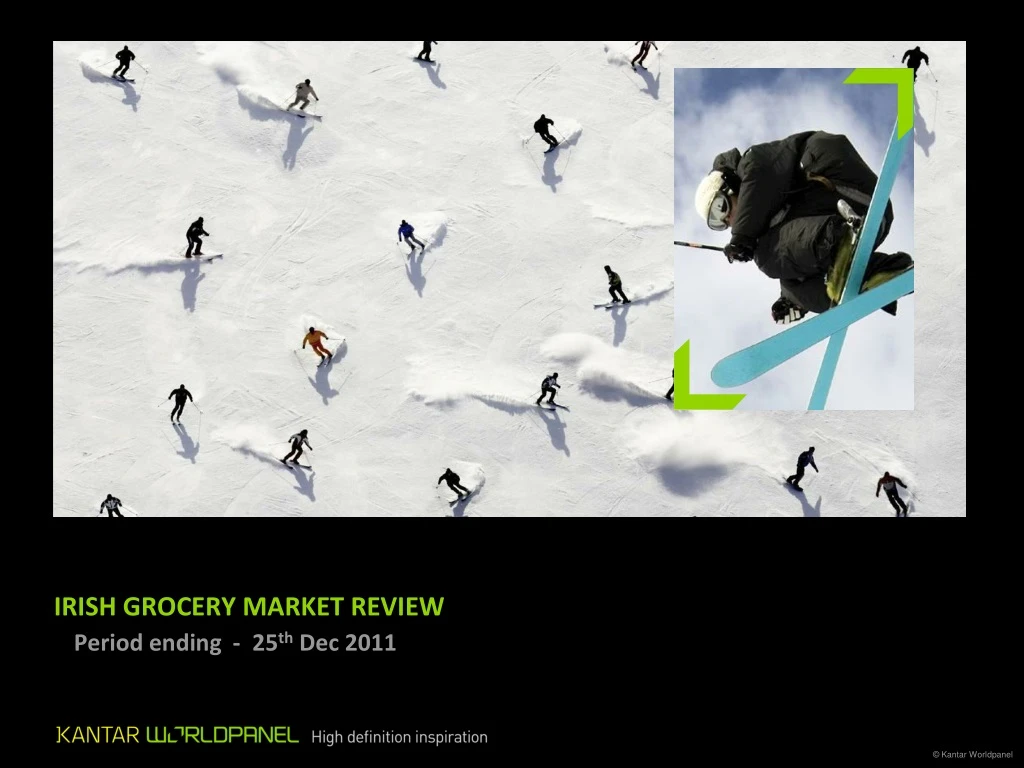
IRISH GROCERY MARKET REVIEW Period ending - 25th Dec 2011
OVERVIEW • Market Overview • The annual market sales are ahead of last year, with growth of +0.5% year-on-year. The food market is showing stronger growth (0.9% year on year) than the non-food market. • Over the shorter term, market value has increased by +1% as shoppers buy more volume despite price inflation, and compensate by purchasing on offer and trading down to cheaper lines. • Consumers are making more shopping trips, but reducing their average spend per trip.
Key themes in the marketplace Stability Store Choice Inflation Trading Down Smaller Trips
The period 2001 to 2008 saw average growth of 7% per annum and overall +58% over the whole period Annual value of take home grocery (€b) +8% +6% +6% +6% +6% +7% +8% Data to 52 week ending August
The market value declined in 2010 by 6% but has now stabilised Annual value of take home grocery (€b) +8% +6% +6% +6% +6% +7% +8% +1% -6% +1% Data to 52 week ending August
The Irish grocery marketremains in growth this period with 12w sales up +1% on this period last year Total Grocery Market Value Sales and YOY Growth -2.8% +0.5% +1.9% +1.0%
ROI Total Grocery Market Volume Sales and YOY Growth Volume sales are in decline on a yearly basis while growth remains flat over the shorter term -0.3% -1% -0.7% 0.3% -1.7% +0% 52 we packs 12 we packs w/e 25 Dec 2011
Ambient Food 31% Fresh & Chilled Produce 44% Household 7% Frozen 5% Toiletries 4% Alcohol 9% Healthcare 1% 12w Total Grocery – Sectors Value Shares & YoY % Change Fresh Food, Ambient Food, and Toiletriessectors have driven 12w growth Share of total trolley Total Trolley +1.0% value
Which categories are performing well?Chilled Drinkshas performed best YoY, shoppers also spending more on Sweet Home Cooking, Frozen Confectionary and Fresh Poultry 12w Total Grocery - value %chg by category
Categories with a lot of perceived promotional activityToiletries, Alcohol and Drinkshave the highest proportion of packs sold on deal. Staples such as Dairy and Bakery have low promotional levels 12w Total Grocery - pack % sold on deal by category
Change in value sales – Total grocery sectorsAmbient and Fresh performing well over shorter periods % Value Change w/e 25 Dec 2011 11
What is the size of the total food market?The total food market shows stronger growth than non food this period -2.4% +0.9% +2.8% +1.9% 52 we €000’s 12 we €000’s w/e 25 Dec 2011
Growth for the Food market – QuarterlyThe food market has shown growth on the same period last year 12 w/e 25 Dec 2011
Change in Household Spend (%) and Inflation Rate Household Spend change is holding behind inflation, though both are now in positive growth year on year % change year on year – 12 weekly period
12w Total Grocery - changes in consumer shopping behaviour Irish households are shopping more often this year, but spending less per trip Average frequency increased by +5.0% €12 increase in 12w spend per HH (+0.9%) Average basket spend reduced by -3.9%
12w Total Grocery - Consumer Coping Strategies Trended Trading down and buying on offer has been a key theme for shoppers since the start of 2008
Shoppers are increasingly turning to Non Branded Products – (Private Label and No Brand Name*) Christmas 2011:Branded Sales: -1%Private Label: +6% 46% Non Branded Share Of Grocery Market 45% 44% 43% 42% 2007 2008 2009 2010 2011 *No brand name includes loose fruit & Veg, loose meat etc. 18
Grocery Packs Growth by branded, no brand name* and Private label tier.Standard and value PL in growth and also non branded products Growth in Grocery sales (Packs) Share of sales *No brand name includes loose fruit & Veg, loose meat etc.
12w Private Label Value Share of Total Grocery MarketPrivate label value share has dropped back in the run up to Christmas when consumers tend to prefer brands Private Label Value Share of Grocery
PROMOTIONAL ACTIVITY IN THE TOTAL GROCERY SECTORPromotions still remain an important part of the grocery sector – however compared to 2009 Promotions are back % Packs Sold on Deal in Total Grocery, 21
SHOPPING BEHAVIOUR THROUGH CHRISTMAS: SALES (4 week sales)Shoppers cut back spend in Jan as they buy fewer packs, but purchasing picks up again in Feb -14.2% +5.8%
SHOPPING BEHAVIOUR THROUGH CHRISTMAS: BASKET SIZE4w share of purchase occasions by trip type Increase in big shops in Dec, but normal habits are quickly resumed after Christmas
SHOPPING BEHAVIOUR THROUGH CHRISTMAS: BRANDED4w value salesBranded goods have a higher share at Christmas, but this drops back in the new year as shoppers look to reduce expenditure -14.2% +5.8%
UK Grocery Update to 25 Dec 2011 – Market Trends Summary • Inflation rate has started to fall this period. Although prices are still rising, the annual rate at which they are rising has fallen for the first time since late 2010. • The level of trading down has reduced to 1.8% due to the fall in inflation and less promotional discount on offer. • Retailers have changed their focus to concentrate their efforts on price competitiveness and away from pushing promotions this period. • With fewer promotions to turn to, consumers are seeking other ways to trade down. The marked increase in frequency & decline in basket size is indicative of consumer shopping around for the best deals. We have also seen the rise in private label sales and decline in branded and also the continued growth in Budget sales. • Conversely we see a different tranche of consumers wanting to indulge, possibly at the expense of eating out, as demonstrated by the Premium growth, both in brands and retailers.
Grocery Market Sales Performance 10 yrs 3 yrs 1 yr +51% -4% +1% +58% +15% +4% 27
UK Total Grocery - Value & Household Spend % Change Year on YearShoppers in the UK also manage to keep spend below rising inflation
Trading–Up and Trading–Down Strategies Shoppers no longer able to save through buying promotions but use trading down product as the main way to save money Grocery (RST) 12we 25 Dec 2011 (KWP P1) 29
UK Grocery Volume (Packs) Growth by Price BandConsumers in the UK continue to trade down to cheaper products. We see an increase in budget products this year which accounts for over a quarter of UK grocery sales Growth in Grocery sales (Packs) Change in sales Share of sales 12 W/e 25 Dec 11
Grocery Volume (Packs) Growth by Private Label TierBudget Private label also shows growth while branded products fall back Growth in Grocery sales (Packs) Change in sales Share of sales 12 W/e 25 Dec 11