Download
1 / 14
140 likes | 274 Views
FCM PI Impact Assessment Update. Assessment Method, Assumptions and Data. Paul J. Hibbard Analysis Group June 4, 2013. Overview. FCM PI vs. FCM Status Quo (and alternatives) March 1 Meeting Overview of impact analysis Role of Analysis Group Potential additional scope items

E N D
FCM PI Impact Assessment Update Assessment Method, Assumptions and Data Paul J. Hibbard Analysis Group June 4, 2013
Overview • FCM PI vs. FCM Status Quo (and alternatives) • March 1 Meeting • Overview of impact analysis • Role of Analysis Group • Potential additional scope items • April 10 Meeting • Proposed analytic approach • Key elements of scenarios • Expected sources of data and assumptions • Today • Model construct and status • Scenarios and assumptions, data sources • Examples of outputs • Feedback on inputs
Reminder: Analytic Approach • Comparison • Status Quo • FCM PI • NRG Alternative (under review by AG, ISO) • What is the difference? • With FCM PI, existing and new resources will adjust offers based on expected performance revenues (positive and negative) and perceived risk • This will effectively alter the supply curve for the capacity market • …changing clearing prices, cost to load, and revenues to suppliers • …changing the mix of resources in the market • …changing system reliability • Impact on supply curves depends on many assumptions • Initial review of a realistic set of scenarios
Analytic Approach • Approach to estimating offers by market participants in the FCM PI case (see ISO April 9th MC presentation) Status Quo Offers
Key Data Sources, Assumptions • Demand • Net ICR from RSP for 2018/2019 • High/Low sensitivities to represent potential range of outcomes over time • Resources • Existing generation from FCA7, including delists • Passive DR from FCA7 • AG estimates of active DR and imports based on FCA results and ISO data • Renewables (on-shore wind) sufficient to meet RPS requirements per RSP for 2018/2019 • Additional new generation CC/CT (based on ORTP costs, with market revenue estimates updated by AG)
Key Data Sources, Assumptions (cont’d) • System Parameters: expectations based on past performance • Reserve shortage hours (H) based on system data 2010-2012, and ISO modeling of at criteria conditions • Actual reserve shortages under current RCPFs ($500 system) (simulated 1/10 – 5/12) ~ 3.2 hours/year • Sensitivities to capture potential future conditions (e.g., low and high values with the system “at criteria”) • Unit performance (A) based on 2010 – 2012 operations, with variations based on seasonal pattern of assumed shortages • Shortages spread across all months • Shortages mostly in summer (2011 pattern) • Shortages mostly outside of summer (2010 pattern) • Balancing ratio based on review of system data 2010-2012 • PPR set to $5,000 (high/low sensitivities at $4,000, $6,000)
Key Data Sources, Assumptions (cont’d) • Going-Forward Costs (GFCs) • Fixed Costs (FC) and Variable Costs (VC) based on unit-specific data from SNL • Investment Costs (I) reflect annualized cost of new capital investments (e.g., new plant, environmental compliance, dual fuel upgrades) • AG estimates, using updated ORTP financial assumptions • Net generation (Q) based on actual unit output 2010-2012 • Heat rates (HR) based on unit-specific data from SNL • Fuel prices (Pfuel) based on NYMEX forward prices (natural gas), SNL (uranium), ORTP (biomass), and EIA (the rest) • Market prices (P) reflect energy and reserve/AS revenues from 2010-2012, adjusted for forecast fuel price expectations • PI Risk Premium (RF) based on AG estimates
Key Data Sources, Assumptions (cont’d) • Variations on GFC related to incremental investment in existing assets: • Dual fuel capability costs (based on AG analysis) • Fixed costs to maintain • Investment costs to establish, or recommission • Investments made if additional net FCM PI revenues (due to improved performance) exceed incremental GFC • Environmental compliance investment • Identify units potentially affected by EPA air, water, and ash regulations (ISO analysis, AG review) between now and 2020 • Estimate investment and annual fixed cost increments for compliance (ISO and NERC analysis, AG review) • Consider 3 scenarios • No compliance investments • Moderate compliance investments • Severe compliance investments
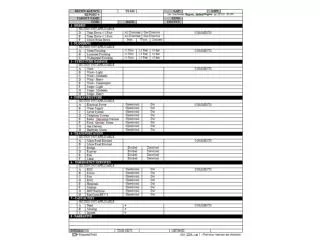
Model Inputs Existing Units: unit- and plant-level data from SNL, ISO • Operating capacity, net generation (historical) • Variable non-fuel production costs ($/MWh) • Fixed production costs ($/kW-yr) • Heat rate • Potential for dual fuel capability • Environmental compliance obligations, estimated costs • Missing values extrapolated with representative technology/fuel-type class data New Units: based on ORTP analysis, updated for current market conditions
Sample Model Outputs • Supply curves based on GFC and PI offer adjustments for existing and new units • Developed for a number of scenarios • Generate results with PI, without, and difference: • Clearing price • Supplier payments, surplus • Load payments
Sample Model Outputs With and without PI, and difference Changes to resource mix by asset class Units that clear, delist
Areas of Inquiry • How does FCM PI affect clearing prices? Revenues to generators? Costs to load? • Do offers from new entry increase or decrease as a result of FCM PI? Existing asset classes? • To what extent would FCM PI drive retirements for units with poor performance or compliance investments? • How sensitive is the FCM PI clearing price to various system parameters? • To what extent may FCM PI change the resource mix? • How would FCM PI affect reliability through improving aggregate system performance due to resource mix changes? • Directionally, how would FCM PI likely affect energy market outcomes (e.g., fewer RT price spikes, reductions in NCPC)?
Next Steps Complete preparation of input data analysis and quality control checks on model Review results, compare outcomes under various scenarios • High/low ICR • FCM PI parameters (H, A, BR, PPR) • Environmental compliance obligations Construct analysis of NRG alternative Review results with stakeholders (July)
Paul J. HibbardAnalysis Group111 Huntington Avenue, 10th Floor Boston, MA 20199phibbard@analysisgroup.com617-425-8171