Download
1 / 9
90 likes | 433 Views
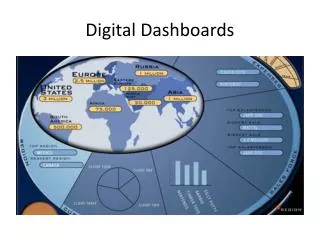
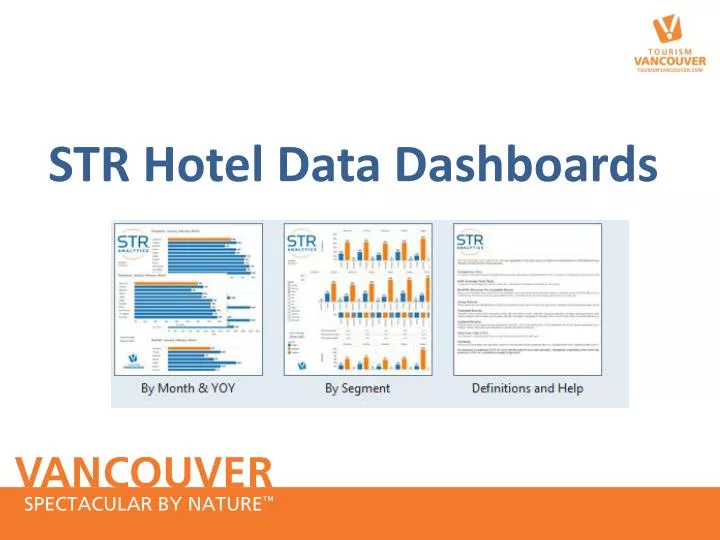
STR Hotel Data Dashboards. STR Dashboards – Hotel data. These are interactive Tableau dashboards. Members can select: year (2007 to 2014 YTD) and month/s View data for: Occupancy ADR RevPAR By Segment : Group Transient Contract.

E N D
STR Dashboards – Hotel data These are interactive Tableau dashboards. Members can select: • year (2007 to 2014 YTD) and month/s View data for: • Occupancy • ADR • RevPAR By Segment: • Group • Transient • Contract For the following Markets (metro and downtown): • Vancouver • Vancouver Downtown • Toronto • Toronto Downtown • Montreal • Montreal Downtown • Ottawa • Downtown Ottawa • Calgary • Downtown Calgary • Seattle • Seattle Downtown • Portland • Portland Downtown • Denver • Denver Downtown • San Francisco • San Francisco Downtown • Los Angeles • Los Angeles Downtown • San Diego, • San Diego Downtown
Occupancy, ADR and RevPAR by Month and YOY – LocationClick on ‘Location’ Drop Down arrow to select either Downtown or Metro data.See ‘Data Through..’ under ‘Month’ for the most current month for 2014.
Occupancy, ADR and RevPAR by Month and YOY – YearClick on ‘Year’ Drop Down arrow to select year from 2008 to 2014.
Occupancy, ADR and RevPAR by Month and Segment (Group, Transient and Contract) – LocationClick on ‘Location’ Drop Down arrow to select either Downtown or Metro data.
Occupancy, ADR and RevPAR by Month and Segment (Group, Transient and Contract) – YearClick on ‘Year’ Drop Down arrow to select year from 2007 to 2014.
To view Annual/Year-end data select:1. Select Location: Downtown or Metro2. Select Year: from 2007 to 20133. Click on (All) under Month
Definitions and Help To return to prior views, click the back button in the top left hand corner.
Historical hotel data tables (in PDF) on Members extranet • If you are unable to download the Tableau reader, you will be able to view the dashboards, saved as PDF’s, on the members extranet. http://www.tourismvancouver.com/members/member-login/performance-monitoring/str-hotel-data-dashboards/ • Members can view annual data by Segment and Location for: • 2007 • 2008 • 2009 • 2010 • 2011 • 2012 • 2013 • 2014 YTD (the dashboard will indicate what the current data month is). • Members can view annual data by location YOY from 2008 to 2014 YTD. • For more information on STR Dashboards please contact: • Nicolette Douglas at ndouglas@tourismvancouver.com • For more information on STR monthly data please contact: • Angela Wu at awu@tourismvancouver.com