Download
1 / 58
580 likes | 795 Views
Chicago Mercantile Exchange information sources. http://www.cmegroup.com/tools-information/index.html. 2008. Next wk. normal. *. 4/28/08. Max. Upside Potential: variable cost of ethanol production, tax credits, And gasoline-ethanol prices . Dec. 08 Corn. Gaps: $5.20, $5.405, $5.598

E N D
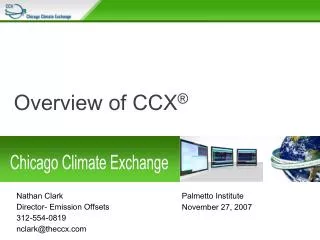
Chicago Mercantile Exchange information sources http://www.cmegroup.com/tools-information/index.html
Next wk. normal * 4/28/08
Max. Upside Potential: variable cost of ethanol production, tax credits, And gasoline-ethanol prices Dec. 08 Corn Gaps: $5.20, $5.405, $5.598 Major risk: cutting tax credit For ethanol
Nov. 08 Soybeans Down-side Risk: Gap @ $10.54
Cash Flow Risk Ratio for Corn Partly from Dr. William Edwards, ISU Economics Department 50/50 1/3-2/3 Crop April 08 Owners Renter Share Buyer Cash flow cost per acre $458 $720 $318 $714 Govt. payments? -$9 -$9 -$4.50 -$9 Cash needed from sales $449 $711 $705 $313.5 Expected or actual yield (bu.) 185 185 92.5 185 Cash flow breakeven price $2.43 $3.84 $3.39 $3.81 Hedged market price ($/bu) $5.72 $5.72 $5.72 $5.72 Cash flow risk ratio 42% 67% 59% 67% Cash flow R. R., $4.70 price? 52% 82% 72% 81% Interpretation: @ $4.70 price, Owners need to sell 52% of crop to cover cash-flow needs.
Table 5. Example Net Worth Risk Ratios For Corn in Central Iowa April 08 OwnersRentersCrop-shareBuyers 000 $ assets$3,350 $357.3$250.21,721.7 000 $ liabilities$0$185.3$84.6$596.0 000 Net worth$3,350 $172.0165.61,125.7 Net worth risked (10%) 335,00017,20016,560 112,570 Crop acres600600600600Net worth risk ratio$558 $28.67$27.6$187.6 Max.Loss/bu.,norm. yld. $3.02 $0.155 $0.298 $1.01 Price for max. loss -$0.59 $3.68 $3.09 $2.80 Interpretation: A loss of $0.16/bu. (from cash-flow break-even price would reduce renter’s net worth by 10%.
Cash Flow Break-even & Risk Ratio for Soybeans Partly from Dr. William Edwards, ISU Economics Department 50/50 1/3-2/3 April 08 Crop Owners Renter Share Buyer $160.5 $523 Cash flow cost per acre $255 $503 Govt. payments? -$12 -$12 -$6 -$12 $154.5 Cash needed from sales $243 $491 $511 Expected or actual yield 50 50 25 50 ( bu .)/ A Cash flow breakeven price $4.86 $9.82 $6.18 $10.22 $11.09 Hedged market price ($/ bu ) $11.09 $11.09 $11.09 Cash flow risk ratio 44% 56% 92% 89% Risk Ratio at $9.60/bu. price 51% 102% 64% 106% Interpretation: @ $11.09 price, Owners need to sell 44% of crop to cover cash-flow needs.
Assignment II: Advisory Service Performance http://www.farmdoc.uiuc.edu/agmas/reports/03_06/text.html • Univ. of Illinois does an annual evaluation of Ag Market Advisory • Services. You can get the report at the above web address. • Assignment: Working individually or in teams of 2-4 people, answer • these questions: • For the advisory services as a group, how much better in • average cents per bushel are they than the average price received • by farmers? __________corn _____________ soybeans • For the services as a group, how does their average price • compare with the 20-month market benchmark? Corn _____ • Soybeans _______________ . • 3. For the services as a group, how does their average price • compare with the 24-month market benchmark? _________ • Corn, _______________ Soybeans.
http://www.farmdoc.uiuc.edu/agmas/reports/03_06/text.html • Univ. of Illinois annual evaluation of Ag Market Advisory • Services, assignment, cont. • Questions: • Has any one advisory service been able to beat the 24 month • market benchmark every year over the study period? On Corn? ___ • _________________. On Soybeans? ____________________. • How much does the ranking of individual advisory services vary • from year to year? ____________________________ . • Brock is an advisory service used by Cargill in some of its • Contracts. On average, how has Brock ranked among advisory • Services? On corn?________ On soybeans?________ • Pro Farmer is headquartered in Cedar Falls, Iowa. How has it • Ranked among advisory services? On corn?________Soybeans?___ • _________________________.
Storage Economics • Costs to store on & off farm • Seasonality of prices • Harvest basis & carrying charge • Timing and amount of cash-flow needs
Post Harvest Seasonal Price Trends Fact: Since 1990, the May cash corn price has exceeded October in 14 of 17 years (82%).
Post Harvest Seasonal Price Trends Fact: Since 1990, the May cash soybean price has exceeded October in 12 of 17 years (71%).
Carrying Charges and Selling the Carry CBOT Corn Futures: October 16,2006 What determines price differences between delivery months (e.g. December vs. March corn)? Is it expectations? These price differences reflect market determined storage costs (aka carrying charges). Large carrying charges, where deferred contracts trade at a premium to nearby contracts, are common when free supplies are large.
sell tomorrow?!? Store grain today and… Carrying Charges and Selling the Carry
Jewell 4/24/08 Store or sell now? Market Signals? April 08 May June July August FH Sep LH Sep October November December January 09 February March April 09
What is the carry? CBOT Corn FuturesCarrying Chargesat Harvest
4/23/08 Heart of Iowa Cooperative
What is the carry? CBOT Soybean FuturesCarrying Chargesat Harvest
Are Market Prices High? CBOT July Corn Futures Years after 1980 when July corn was greater than $2.90 at harvest. Eight of ten years (80%) the July declined, an average of 3 cents per bushel for all years.
Sizing Up the Market Assumes… 8% interest rate $3.00/bu cash corn $4.00/bu cash wheat $7.00/bu cash soybeans In/out costs* of… 8 cents/bu corn 11 cents/bu soybeans 8 cents/bu wheat * Based on estimates of NDSU Extension Service
On-farm Corn Storage Costs7 months (@ $5.78/Bu.) • Extra shrink to 13% $0.145 • Extra drying to 13% 0.04 • Interest @ 7% 0.236 • Handling 0.02 • Quality deterioration (1%) 0.058 Total 0.499 $6.40 May call = $0.90/bu.
On-farm Corn Storage Costs3 months (@ $5.78/Bu.) Jewell Price premium, harvest to January = $0.11 • Extra shrink to 13% $0.00 • Extra drying to 13% 0.00 • Interest @ 7% 0.101 • Handling 0.02 • Quality deterioration (1%) 0.00 Total 0.121 $6.40 May call = $0.90/bu.
Off-farm Corn Storage Costs8 months • Extra shrink to 14% $0.08 • Extra drying to 14% 0.03 • Interest @ 7% 0.27 Handling 0.00 • Storage 0.225 • Total 0.605 • Price-later 0.495
On-farm Soybean Storage Costs: 3 months @ $11.36/Bu. Interest @ 7% $0.20 • Handling 0.02 • Quality deterioration (1%) 0.00 Total 0.22 HOI Jan. 09 bid vs. Oct. 08 +0.15
$ Under July futures Theoretical Seasonal pattern for C. Iowa July basis 0.0 Transportation cost to Chicago Storage costs to July delivery 0.25 0.50 Oct. Dec. Feb. April June July
Note Down-side Risk in Grain Exports, Reflecting Foreign Weather & Lagged Price Response
China: a wild card in the corn market 2007-09 projected net China exports: 16 mil. Bu., Future imports likely.
New Crop Corn Seasonal Trend 75% Odds: Spring Price Exceeds Harvest Price CBOTdata Source: U of MN, CFFM, 2007.
Net-Worth Risk Ratio • The maximum dollars per acre which can be lost in any one year before a predetermined percentage of the equity is lost.
Calculating Net-Worth Risk Ratio • Max. dollars of net worth to be placed at risk divided by number of acres = Max.$ that can be risked per acre • To compute max. loss per bu. : divide $/A. by normal yld. = $/bu. that can be risked for pre-determined loss of equity
Mktg. Plan • Starting point in a mktg plan: financial needs of the business • Know your break-even price • Know your risk-bearing ability • Plan marketing with a goal of at least covering cash-flow needs • Look for mktg. & insurance tools to minimize risk of losing the business • Role of Offer Contracts • Timing