Download
1 / 28
280 likes | 287 Views
Wavelength Influence on Algal Growth. By: Aidan Madjerich Grade 9 Central Catholic High School PJAS 2019. Question. How do different wavelengths of light affect Chlamydomonas reinhardtii population growth?. Light Spectrum.

E N D
Wavelength Influence on Algal Growth By: Aidan Madjerich Grade 9 Central Catholic High School PJAS 2019
Question • How do different wavelengths of light affect Chlamydomonas reinhardtii population growth?
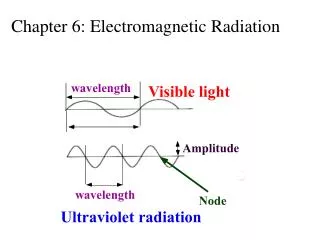
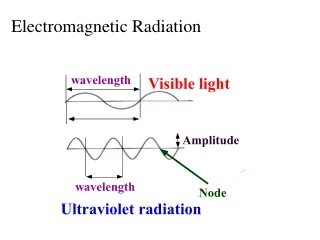
Light Spectrum Most plants and algae absorb and/or deflect varying wavelengths of light. Blue, White, Green, and Red lights were used
Photosynthesis • Light energy is used to synthesize carbohydrates and/or other rich molecules • In Eukaryotic photosynthetic cells, chloroplasts serve as the photosynthetic organelle.
Chlamydomonas reinhardtii • An autotrophic, single celled flagellate • Both freshwater and saltwater are fundamental habitats • Reproduction is mainly asexual, but sexual fusion can occur • Tolerant of wide range of light intensities • Used in many models, such as phototaxis, due to simplicity and clarity in function
Phototaxis • An eyespot detects the surrounding environment for light • Intensity of light on the eyespot acts as a signal • Cell body develops a cyclic movement between light and no light • Can move away or towards light
Purpose • To determine the effects of different wavelengths of light on Chlamydomonas reinhardtii population growth
Hypotheses • Null: The wavelengths will not vary significantly in their effect on Chlamydomonas reinhardtii population growth • Alternative: The colored lights will significantly vary in their effect on the population growth of Chlamydomonas reinhardtii
Materials • Chlamydomonas Reinhardtii (Carolina Science) • Soil Water • Spring Water • One (1) red flood light emitting bulb, 13.5 Watt • One (1) blue flood light emitting bulb, 13.5 Watt • One (1) white flood light emitting bulb, 12.0 Watt • One (1) green flood light emitting bulb, 13.5 Watt • (21) borosilicate culture test tubes (13 X 100mm) • One (1) Spectrometer • One (1) Hemocytometer • One (1) Macropipette • One (1) Micropipette
Procedure • 15mLs of algae, 12mLs of spring water, and 3mLs of soil water were pipetted into each of the five (5) 50 mL conical tubes • Once the solution was fully mixed and set out for about a day, 5mL of the solution was pipetted into (20) culture tubes • Five (5) culture tubes were placed in a tube rack and each one of these rack were directly placed under each light (approximately 1.0 meter from the bulb) • Each rack was exposed to (16) hours of light and (8) hours of no light each day • Absorbance readings were taken at 430nm every two (2) days
Procedure (continued) • The racks were placed with the culture tubes under each correct light fixture • Previous two (2) steps were repeated seven (7) times total • On day ten (10), cell counts were performed using a hemocytometer
P value: P values: Day 2=9.33 * 10^-7. Day 4=3.79 * 10^-9. Day 8=5.52 * 10^-13. Day 14=1.87 * 10^-16 Results Dunnett’s Test T-crit= 3.29 Sig. Variation for all Samples
DAY 10 Hemocytometer (Day 10) Dunnett’s Test T-crit= 3.29 Sig Variation Sig Variation Sig Variation Control P-value: 3.27 * 10^-11
Conclusion • The Null Hypothesis can be rejected for days 2-14. • The order of growth stimulation: Blue, White, Red, Green • The t-tests show that each experimental group varied significantly when compared to the control (White) for days 2-14. • Order of greatest cell/mL concentration: Blue, White, Red, Green • Null can be denied for the Hemocytometer results • The t-test showed variation for all 3 experimental groups
Limitations And Extensions Limitations • Possible intruding light on the tested algae. • Unknown power of light effect on the tested sample • Unknown initial health of Algal samples Extensions • Use the same bulbs with the same wattage and power • Use a photometer to determine the exact exposure • Optimal schedule of lighting on the algae
References • Algae Research and Supply. “Lighting for Algae Cultures.” Retrieved from:https://algaeresearchsupply.com/pages/lighting-for-algae-cultures • Neubert, David. (2017 July 26). “Seeing Things in a Different Light.” Retrieved from:https://www.batteriesplus.com/blog/lighting/seeing-things-in-a-different-light • Mooij, Tim. (April 2016). “Impact of Light Color on Photobioreactor Productivity.” Retrievd from: ttps://www.sciencedirect.com/science/article/pii/S2211926416300261
Hemocytometer • A Hemocytometer is a scientific instrument used to count the amount of viable and/or unviable cells in a certain unit. • It is a rectangular slide that contains a laser-etched grid in the middle of two (2) chambers • Originally used to count red blood cells, it is now been adapted to encompass a wide variety of microbes
Spectrophotometer A Spectrometer is another type of scientific instrument specifically designed to examine a spectrum of variables The set wavelength on the spectrometer is usually 430nm because that is the measurement of Chlorophyll A’s performance and/or ability to absorb light