Download
1 / 9
90 likes | 198 Views
Last week. No bias current Resonant Frequency: 34.963 MHz Forward power: 5.04 kW Reverse power: 729 W Cavity voltage: 2.7375 V (p-p) Q = 64.6 at ~5 kW No high loss effect observed. Plan of attack. Try another Toshiba core (these are the lossiest cores that we have)

E N D
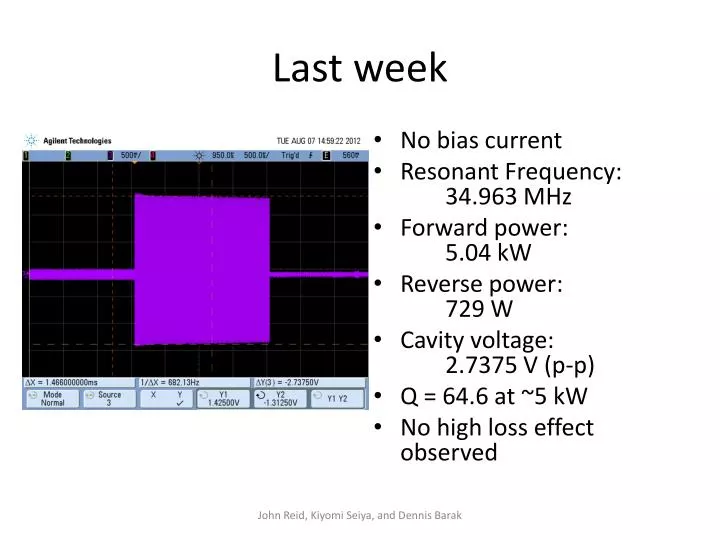
Last week • No bias current • Resonant Frequency: 34.963 MHz • Forward power: 5.04 kW • Reverse power: 729 W • Cavity voltage: 2.7375 V (p-p) • Q = 64.6 at ~5 kW • No high loss effect observed John Reid, KiyomiSeiya, and Dennis Barak
Plan of attack • Try another Toshiba core (these are the lossiest cores that we have) • Make high power measurements of the fixture without any cores inserted • Including Q • Introduce a bias current and make high power measurements • Try a new core? John Reid, Kiyomi Seiya, Dennis Barak
TOS 0979 core • No bias current • The high loss effect was not observed even with 6.57 kW of forward power. • Q measurements • Q = 67.4 at about 5 kW (SG set to +7.1 dBm) • Q = 87.5 at lower power (SG set to 0 dBm) • Very similar to the other Toshiba core (TOS 9070) John Reid, Kiyomi Seiya, Dennis Barak
Measurements of unloaded structure • Forward power: 4 kW • Reverse power: 389 W • Resonant frequency: 42.2975 MHz • Cavity voltage: 10.825 V • Q measurements • Q = 669 (SG set to +7.1 dBm) • Q = 778.6 (SG set to 0 dBm) • Q did not change too drastically compared to the loaded structure John Reid, Kiyomi Seiya, Dennis Barak
Try biasing the core • Slowly increased the bias current while finding the resonant frequency with each change in bias current • The high loss effect was observed with a bias current of 1500 A • TOS 0979 core • Forward power: 4.289 kW • Reverse power: 328 W • Cavity pickup voltage: • 6.2 V before high loss effect • About 5 V after high loss effect John Reid, Kiyomi Seiya, Dennis Barak
High loss effect – cavity pickup John Reid, Kiyomi Seiya, Dennis Barak
Follow-on burst John Reid, Kiyomi Seiya, Dennis Barak
High loss at maximum bias current? • Bias current: 10,000 A • Forward power: 4.22 kW • Reverse power: 243 W • Cavity pickup voltage: 11.125 V (p-p) • SG setting: +9 dBm • Q: 655 • No high loss effect John Reid, Kiyomi Seiya, Dennis Barak
Next steps • Compare these measurements to older data • Place a stackpole core inside the structure and make the same measurements • Try a new core • Continue to characterize our measurements • Possible issue: • The return bus bar was getting hot at 10,000 A. • The current was dropping by about 5 A every single pulse while components were warming up. • Testing of new ferrites will start once we understand the results that we are getting John Reid, Kiyomi Seiya, Dennis Barak