Download
1 / 12
120 likes | 320 Views
Simulations of irradiated detectors: E(x) & parameterization RD50 Simulation Working Group Meeting March 27 th - 28 th 2013. T. Peltola 1) , J. Härkönen 1) 1) Helsinki Institute of Physics, CMS Tracker Project. Outline Status of irradiated Si detector simulations with Synopsys TCAD

E N D
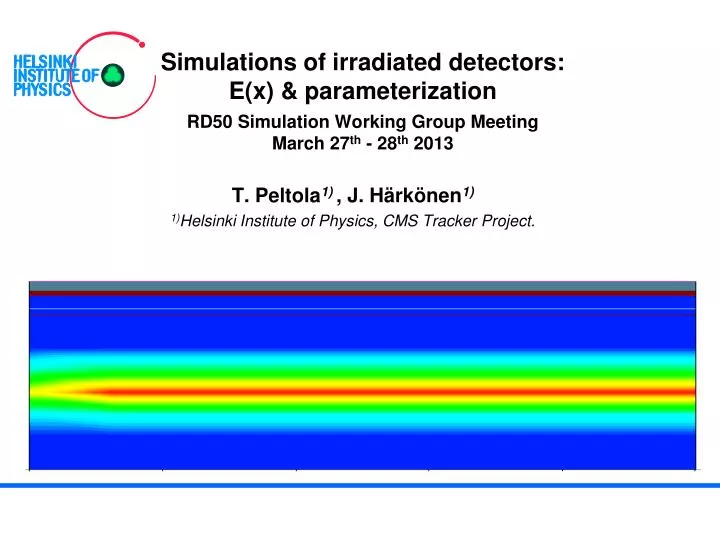
Simulations of irradiated detectors: E(x) & parameterization • RD50 Simulation Working Group Meeting • March 27th - 28th 2013 • T. Peltola1) , J. Härkönen1) • 1)Helsinki Institute of Physics, CMS Tracker Project.
Outline • Status of irradiated Si detector simulations with Synopsys TCAD • Results of E(x) simulations • Parameters and parameterization • p-type device: EVL and Petasecca defect models • SiBT measured and simulated p-type detector CCE • Future plan / work in progress • edge-TCT Timo Peltola, RD50 meeting, March 27th - 28th 2013
Tuning of EVL-defect model:GDD, GDA • Current cannot be introduced by adding the suggested "trap" E = EC - 0.65eV • Current introduction rates GDD and GDA modified to match experimental value of leakage current n-type device, 1 μm x 1 μm x 300 μm α (290K)= 4·10-17 A·cm-1 Ф =1014 cm-2 I = V·α·Ф ~ 1.2·10-12 A EVL: Modified: Timo Peltola, RD50 meeting, March 27th - 28th 2013
Tuning of GDD , GDA: Neff , E(x) • GDD and GDA = 0.285 • Synopsys model not matching with Eremin’s simulation: • No double peak behaviour at Φ= 3e14 cm-2 • ~90μm difference in Neff sign change at • Φ= 5e14 cm-2 • The missing bulk generated current level is not compensated by simply tuning GDD, GDA at Φ> 1e14 cm-2 290K, 300V Neff conc. simulated by V. Eremin Neff conc. simulated on Synopsys-TCAD • GDD and GDA = 0.285 290K, 300V E(x) simulated by V. Eremin E(x) simulated on Synopsys-TCAD Timo Peltola, RD50 meeting, March 27th - 28th 2013
Tuning of EVL-defect model:Defect concentrations • EVL defect model, tuned to T = 253 K by Robert Eber, KIT • Method produces correct leakage current & DP behaviour 253K, 300V Timo Peltola, RD50 meeting, March 27th - 28th 2013
Tuning of defect concentrations: Neff , E(x) Synopsys V. Eremin 260K, 300V • Synopsys model differences with Eremin’s simulation: • Double peak behaviour already at Φ= 3e14 cm-2 • ~60μm difference in Neff sign change at • Φ= 5e14 cm-2 • Amplitude differences of Neff and E(x) se = sh = 0.9e-14 cm2 Synopsys V. Eremin se = sh = 0.9e-14 cm2 260K, 300V Timo Peltola, RD50 meeting, March 27th - 28th 2013
Tuning of defect concentrations: Leakage currents • Fluence conversion to simulator input • IV data from VTT 24GeV irradiated minisensors • Part of the fluence region >1e15 neqv cm-2 • 300N @ T = -20°C • Improved match with measurement by Qox(Φ) • Good agreement even at high fluencies • E(x) of the simulated fluencies • Simulated and measured leakage currents 253K 253K [1] D. Bechevet et al. NIM A 479 (2002) 487-497. Timo Peltola, RD50 meeting, March 27th - 28th 2013
P-type detector:Petasecca & EVL models Three-level defect model for p-type @ T = 290 K [2] [2] M. Petasecca et al. NIM A 563 (2006) 192-195 • EV + 0.36 level was not found to contribute to the performance of an irradiated detector • Effective Petasecca defect model for p-type, modified to match leakage current @ T=253K • Petasecca model • Modified EVL-model • Expected DP behaviour observed only with EVL-model 253K, -300V 253K, -300V Timo Peltola, RD50 meeting, March 27th - 28th 2013
P-type MSSD:Petasecca & EVL models • 5-strip structure • 5-120 region • wp = 14 μm • Np = 5e16 cm-3 • T=273K • F = 1e14 – 1e16 cm-2 Petasecca Petasecca • Electric field distributions @ • y = center of the strip 3: • Leakage current matching: • Petasecca tuning @ T=273K Modified EVL Modified EVL • Modified EVL tuning @ T=273K Timo Peltola, RD50 meeting, March 27th - 28th 2013
P-type MSSD:SiBT CCE data • 5-120 region, T = 273 K • FTH300P and 320P active area ≈ 290 μm • Simulated results matching with measured CCE of FTH190P and 320P • Difference in CCE of 200P due to definition of deep diffusion doping profile? • Measured and simulated CCE vsΦ • Simulated deep diffusion doping profile Timo Peltola, RD50 meeting, March 27th - 28th 2013
Work in progress: edge-TCT • MIP trajectories in 300N device: • Goal: extract electric field from drift velocity measurements using eTCT • Collected eTCT generated charges as a function of injection distance • First MSSD simulations produce matching behaviour with measurement • 10 μm • 100 μm mip direction • 250 μm Irradiated 300N eTCT pulses, F = 1e15 cm-2, T=-20°C FZ320N nonirr. eTCT-measurement (M. Fernandez 2013). Vfd ~ 210 V • Vfd ~ 800 V Timo Peltola, RD50 meeting, March 27th - 28th 2013
Summary • Tuning of defect concentrations succesful way to modify EVL-model for Synopsys-TCAD • Double peak formation • Correct leakage currents • Promising CCE results compared with SiBT data • Petasecca model for p-type device does not produce the expected double peak • First edge-TCT simulations match the measured behaviour Timo Peltola, RD50 meeting, March 27th - 28th 2013