Download
1 / 26
270 likes | 381 Views
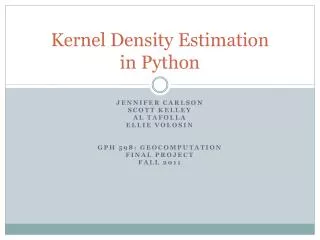
Effective measurement selection in truncated Kernel density estimator. Yoon, Ji Won School of Computer Science and Statistics, Trinity College Dublin [working with Hyoung-joo Lee (Oxford, UK) and Hyoungshick Kim (Cambridge, UK)] ICUIMC , 23, Feb, 2011. Clustering. Clustering.

E N D
Effective measurement selection in truncated Kernel density estimator Yoon, Ji Won School of Computer Science and Statistics, Trinity College Dublin [working with Hyoung-joo Lee (Oxford, UK) and Hyoungshick Kim (Cambridge, UK)] ICUIMC , 23, Feb, 2011
Clustering Clustering
Non-parametric clustering • Mean Shift algorithm (MS) is • One of the simplest non-parametric clustering algorithms; • Based on the Parzen window technique of Kernel Density Estimation in statistics. • Application of MS • in Computer Vision and clustering • Image Segmentation • De-noising
Probability Density Function (PDE) Exact PDE
Mean Shift Algorithm on PDF • Simple interpretation of Mean Shift algorithm • MS clustering is equivalent to a MAP approach to find several local optima for each data points.
Non-parametric Density Estimation • In many cases, the model is not known so we do not know the PDF. • We can not do MAP estimation for unknown PDF. • How can we do MAP operation? • Alternatively, we reconstruct an approximated PDE. • Hint: Use data • by Kernel Density estimation (non-parametric approach)via Parzen window
Approximated PDF via KDE Only with data, we reconstruct underlying PDE
Mean Shift Algorithm • Mean Shift algorithm =Mean shift vector
Mean Shift Algorithm Previous mean Stationary final mean (Local optima) Updated Mean
Question about Mean Shift Algorithm • It is known that MS can be useful in de-noising by clustering the data points. • However, it is not really working because • noise can be located alone. • Then, the noise cannot often be clustered in the main clusters. • Instead, they will have their own isolated clusters for each noise if the noise and other neighboured points are far distant than the bandwidth (or truncation). unwanted positions Desired position
Bandwidth selection problems in Kernel Density Estimation Bandwidth selection is critical in MS.
Bandwidth selection problems in Kernel Density Estimation • Q: Can we remove this separation effect in MS? • = Use Geometric structure to pull such far distance data point into one of major clusters. • Voronoi Mean Shift
Voronoi Diagram • Subdivision of plane (space) into cells • S = {S1,S2,…Sn} points in the plane • V(Si) = { x : d(x, Si) < d(x, Sj) for all j≠ i} The position x’s the nearest neighbor is Si. x Si
Voronoi Kernel for MS Conventional Truncated Kernel Voronoi based Truncated Kernel
Voronoi Mean Shift (VMS) • Finding relevant points • Effective Greedy algorithm • Divide three cases • Inner points • Outer points (case 1) • Outer points (case 2) Relevant Points (their regions overlap the windows) (a) Inner Points (b) Outer Points (case 1) (c) Outer Points (case 2)
Testing Performance • KL divergence • Estimation of KL divergence via Importance sampling
Results • Synthetic datasets (a) Gaussian (b) Banana
Results • Synthetic datasets (Gaussian) (a) MS (b) VMS
Results • Synthetic datasets (Gaussian) (a) MS (b) VMS Here, h=0.5
Results • Synthetic datasets (Gaussian) (b) KL divergence (a) Sampling area (h=0.1)
Results • The number of clusters (Synthetic datasets) (a) Gaussian (b) Banana
Results • Real experimental datasets (a) Original Images (b) Noisy Images
Results MS VMS (b) Filtered Images excluding clusters with less than 5 pixels (a) Filtered Images
Conclusion and Discussion • Advantages of VMS are • A greedy algorithm for Nonlinear gating windowing scheme; • Assigning data points into one of major clusters even with a still small gating size; • Estimating target density more accurately according to KL divergence checking. • Disadvantages of VMS are • Time Complexity • VMS requires extra processing time. • Building Voronoi Diagram before running MS. • Finding relevant point from the Voronoi map. • Blurring effect • Voronoi Kernel is always larger than the conventional Kernel over-smoothing effect
Thanks • If you have any further questions, please feel free to contact me! • yoonj@tcd.ie Or • http://www.cs.tcd.ie/~yoonj