Download
1 / 16
170 likes | 439 Views
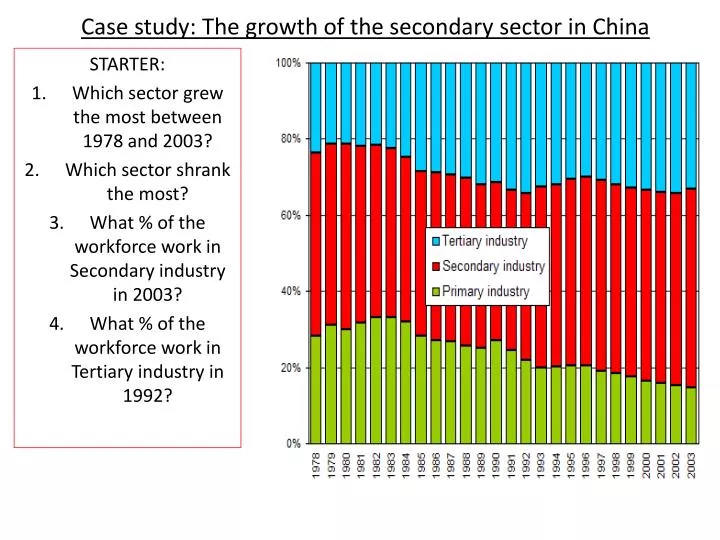
STARTER: Which sector grew the most between 1978 and 2003? Which sector shrank the most? What % of the workforce work in Secondary industry in 2003? What % of the workforce work in Tertiary industry in 1992?. Case study: The growth of the secondary sector in China.

E N D
STARTER: Which sector grew the most between 1978 and 2003? Which sector shrank the most? What % of the workforce work in Secondary industry in 2003? What % of the workforce work in Tertiary industry in 1992? Case study: The growth of the secondary sector in China
In your groups produce a spider diagram identifying the reasons you think that China’s Secondary sector grew THINKSOCIALECONOMICENVIRONMENTALPOLITICAL
China’s growth in the secondary sector Describe the graph. Physical factors 10 minutes to complete the graph and map description in DETAIL use facts and general patterns. Give possible reasons for the map distributions. Draw around your hand in your book and write your 5 facts in each finger Effects Economic Social Environmental Human factors Workforce Government policy Education Private Enterprise Energy Infrastructure improvements Globalisation Describe the distribution of wealth in this map. Comment on the pattern 5 KEY FACTS to remember
Here’s the graph….what do you think the questions would be? 6 marks – you decide how they will be divided up
What’s wrong and right with this answer? Give this student some constructive feedback Have they explained? Have they talked about the CAUSES? Have they used data appropriately? Is it correct? The MIC that I will be talking about is China. China’s secondary sector has grown lots and as a result it there’s lots of pollution from the coal power stations. There are 750,000 deaths due to air and water pollution which is bad. China’s secondary sector has grown because it is located really close to Europe who buy lots of the stuff that they make. Also China trains 600,000 new engineers and 90% of the people are now literate and it has new energy and lots of natural resources. These raw materials mean that the secondary sector can easily be supplied without large transporting costs. Workers are only paid 40p an hour and there is 50% of the population unemployed.
Jan 2012 -What 3 reasons do you know the best? -What piece of evidence are you going to use for each reason? -How do your reasons link together? -What 3 facts/pieces of evidence are you going to use to show that it is specifically about CHINA?
China gdp % • Which sector grew the most between 1978 and 2003? • Which sector shrank the most? • What % of the workforce work in Secondary industry in 2003? • What % of the workforce work in Tertiary industry in 1992?