Download
1 / 39
390 likes | 588 Views
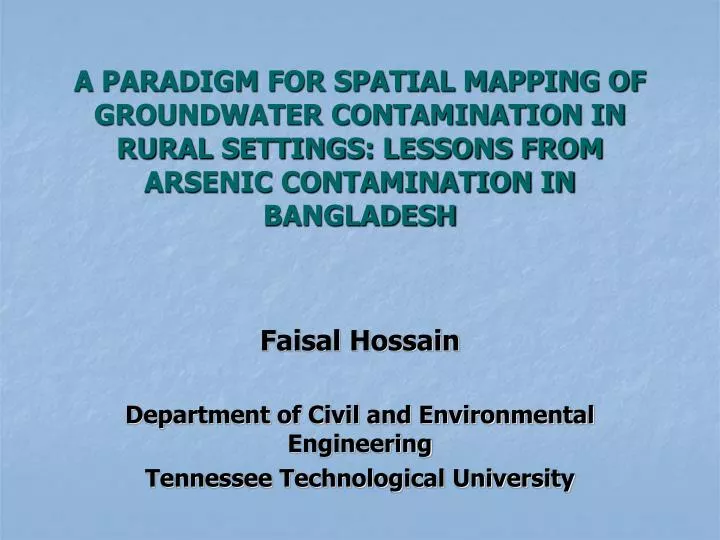
A PARADIGM FOR SPATIAL MAPPING OF GROUNDWATER CONTAMINATION IN RURAL SETTINGS: LESSONS FROM ARSENIC CONTAMINATION IN BANGLADESH. Faisal Hossain Department of Civil and Environmental Engineering Tennessee Technological University. Collaborating Institutions. Tennessee Technological University

E N D
A PARADIGM FOR SPATIAL MAPPING OF GROUNDWATER CONTAMINATION IN RURAL SETTINGS: LESSONS FROM ARSENIC CONTAMINATION IN BANGLADESH Faisal Hossain Department of Civil and Environmental Engineering Tennessee Technological University
Collaborating Institutions • Tennessee Technological University • Tri-State University – Jason Hill • University of Connecticut – Dr. A.C. Bagtzoglou • Griffith University, Australia – Dr. B. Sivakumar • University of Texas, Austin – Dr. Sanjay Srinivasan (and Louis Forster) • Supporting Organizations in Bangladesh – Institute of Water Modeling, Rajshahi University, Bangladesh Council for Scientific and Industrial Research (BCSIR), Ministry of Environment • Others – Nurun Nahar, Md. Delawer Hossain, Sayma Rahman, Shamshuddin Shahid, Abu Saleh Khan, Mafizur Rahman
Groundwater Contamination and Bangladesh LOW LOW HIGH HIGH HIGH From – British Geological Survey
1. More than 50% of Bangladesh population at risk due to Arsenic contamination in shallow aquifers (< 150m). WHAT MAKES SPATIAL MAPPING OF ARSENIC CHALLENGING? 2. Total number of shallow operational drinking wells UNKNOWN (10-18 million). 3. Most shallow wells privately-owned, sunk randomly at short notice, difficult to be updated through inventory control. 4. UNICEF/Government has ‘tested’ about 4-5 million wells using semi-quantitative field kits. 5. Field kits have large false positives and negatives. Question? How can we spatially map aquifer contamination for rural Bangladesh with limited in-situ sampling data? 6. Accurate and time-varying sampling of groundwater quality EXPENSIVE. 7. Spatial mapping accuracy depends of accurate sampling at adequate resolution
Justification for a New Spatial Mapping Scheme for Developing Nations The near impossibility of testing every single shallow well in Bangladesh requires a simulation methodology that can accurately characterize a well as being safe/unsafe without the need for extensive and expensive in-situ sampling tests. Such a method can then act as afast-running and inexpensive proxyto the time-consuming lab-based field campaigns and save considerable testing resources byjudiciously directing them to those wells pre-determined by the simulation method to have a high likelihood of being unsafe. Furthermore, by flagging a safer cluster of wells functional (and an unsafe cluster of wells as non-operational), villagers are expected to find this approachsocially more convenientthan the more expensive house-hold treatment options currently available in Bangladesh.
Outline of Seminar 1st Part • Overview of Groundwater Arsenic Contaminationin Bangladesh: Spatial extent and results from a recent social survey. • Development of Paradigm on Spatial Mapping: Marriage of Non-Linear Chaos Theory with Linear Stochastic Dynamics. • Assessment of conventional geostatistical methods • Chaos-based analysis of spatial pattern of arsenic • Merit of a chaos-based approach • Vision for the Future: A Cost-effective Mapping Scheme that integrates the ‘physics’ of contamination 2nd Part 3rd Part
A DISCLAIMER Work presented from a data-based perspective of spatial mapping.
PART ONE OVERVIEW
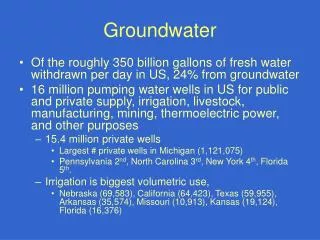
Overview of Arsenic Contamination in Bangladesh • First case of Arsenic in 1993 • Nationwide (BGS-DPHE) survey indicated widespread arsenic - shallow ground water (<150 m) • 80% of population (> 100 million) depend on shallow ground water. • Arsenic is geologic in origin: Pleistocene-Holocene • Million health cases per year projected. • A major Health Disaster in the making for the rural poor
Large-Scale Remedial Efforts(For Rural Bangladesh) • Exploration of the potential of deep aquifers – High $$$ and Long Waiting Time • Understanding the mechanism of Arseniccontaminationfor long-term structural solution– High $$$ and Waiting Time • Closing cluster of unsafe shallow wells. Replacement with treatment options or drill safe shallow wells.Low-Medium $$$ and Waiting Time
Limitations of Ongoing Efforts (Option 3-Closing Wells) • Safe/Unsafe Well detection is by UNRELIABLE FIELD KITS (but very inexpensive). • Total Number of Shallow wells UNKNOWN (10-18 million). Lack of accurate census. • Testing every well and flagging it manually requires LONG WAITING TIME (only 4-5 million wells ‘tested’ so far)+ Inventory is ‘dynamic’ (difficult to monitor). • Not all treatment options (e.g., Filter) appeal to the rural public. – Social compatibility issues. Villagers would rather travel faraway once a day to collect their drinking water (after Haque et al., 2004, Public Health) – Our recent surveys confirm this
Why are Field Kits Unreliable? • Semi-quantitative– based on subjective interpretation. • Detection is ‘probabilistic’: (4 possible outcomes) • Successful Safe Well Detection • Unsuccessful Safe Well Detection (False Alarm) • Successful Unsafe Well Detection • Unsuccessful Unsafe Well Detection (False Hope) [Safe/Unsafe according to 50 or 10 ppb limit] Major Field Kit Brands in use in Bangladesh False Hopes – Silent Poisoning False Alarms – Unnecessary $$$ and Time wastage
Depth (m) Exceedance Probability (>10 ppb) Exceedance Probability (>50 ppb) Reliability Analysis of Field Kits Asia Arsenic Network (AAN)kit- After Hossain et al. (2006) – Hydrological Processes After Rahman et al. (2002)- Env. Sci. Technol.
Cost-effectiveness of Field Kits: Should we discard them altogether? Field Kit test requires minimal training for staff (unlike AAS) Field Kit tests are ‘quick and dirty’, no complicated protocols to follow Field Kits are highly portable and commercially available in bulk qty Source: NAISU – NGO Arsenic Information Support Unit www.naisu.org Field Kits can be ‘soft data’
What type of Spatial Mapping Scheme do We Need for Rural Settings? • A rapid and low-cost methodology to identify cluster of unsafe shallow wells for immediate closure. Justifications: • Rapid? – Too many wells- status unknown (10-18 million). Reduce exposure (Time is of the essence) • Low-cost? – Rural setting (Money is of the essence) • Closure of Unsafe well cluster? – The major difficulty/unknown of remediation effort is accurate identification- Implications for Cambodia, Vietnam, Mexico, West Bengal (India)
Attitude of Rural PublicAfter a Decade: Results from a Recent Survey • Current awareness among villagers is GOOD. • Haque et al. (2004) survey indicates that not all treatment options are socially compatible. • Villagers seem to prefer minimum maintenance, high flow rates, central distribution system. • Traditional water collection by females is still widespread. • Our Survey (conducted by Nurun Nahar of Japan Advanced Institute of Sci and Tech – JAIST and Ministry of Environment, Bangladesh)
Table 1:Population Statistics of the household samples from questionnaire survey Name of Village Number of Affected HHs Population Average number of person per HH No of TW Number of Contamina-ted TW No of Patients Total M F M F Table 3: Female Heads of households’ willingness to walk (in minutes) Affected Village 00 minutes 0-5 minutes 5-10 minutes 10-15 minutes Average Minutes Ranihati 35 163 99 64 4.7 35 35 43 32 Rajarampur 14 56 31 25 4.0 14 14 12 9 Ranihati 27.41% 66.72% 3.31 % 2.56% 3.88 Mianpur 16 66 31 35 4.1 16 16 20 15 Rajarampur 00.00% 96.23% 3.77% 00.00% 4.60 Total 65 285 161 124 75 75 75 56 Mianpur 8.7% 76.7% 14.60% 00.00% 3.74 Legend: HH- Household; TW-Tubewell; M-Male; F-female Contamination is based on arsenic test exceeding 50 ppb Table 2: Households willingness to pay monthly for getting safe water (in taka) Affected Village 00 Taka 00-50 Taka 50-100 Taka 100-200 Taka >200 Taka Ranihati 35.19% 61.21% 1.75% 1.85% 00.00% Rajarampur 30.46% 22.74% 43.32% 3.48% 00.00% Mianpur 59.31% 3.57% 00.00% 00.00% Attitude of Rural PublicAfter a Decade: Results from Our Survey
Income plays a role lower income lower nutrition higher susceptibility to arsenic problems? • Men are more exposed to arsenicosis then women(Reason? outfield work more water intake?) • Marked absence of discrimination –NGO campaigns seem to be effective • 60% willing to pay extra for safe water (up to a dollar) • 70% of womenfolk willing to walk for at least 5 minutes to collect safe drinking water Attitude of Rural PublicAfter a Decade: Results from Our Survey
Part Two DEVELOPING THE PARADIGM FOR SPATIAL MAPPING
Conventional Spatial Mapping Scheme (Estimating at Unsampled Locations) 1.Conventional approach is Geostatistical; E.g. Kriging (and many others…) 2.Based on linear stochastic dynamics. 3. Estimate at unsampled location is a weighted linear combination
Step 1 Random Selection of Zones for an exploratory network (or field campaign) i=i+1 Step 2 • Compute Empirical Variogram • Model Exponential Variogram Step 3 Kriging Step 4 Generate gridded fields of arsenic in log 10 (ppb) Step 5 Assessment of Kriging Assessment of Ordinary Kriging for Arsenic Contamination
Kriging Prediction Prediction Truth Krigging Prediction Safe Unsafe NA NB Safe Unsafe NC ND Assessment of Ordinary Kriging 1. General trends are picked up satisfactorily at scales of > 50 km with large underestimation. 2. Kriging misses the local hot spots due to its smoothing function (Conditional Indicator simulation may be needed)
Indicator Kriging/Simulation • Does not require assumption of normality. • Good for threshold-based estimation. • Handles skewness well (zeros, detection limit issues etc.). • Handles scarce data well. • 3-D Indicator kriging. Indicator kriging represents the spatial continuity of higher arsenic concentrations more accurately than ordinary kriging. Sanjay Srinivasan and Louis Forster – ongoing work
Why Search for Alternative Approaches for Mapping? • Why?: • Conventional Geostatistical methods are two-point schemes – linear correlation between two points separated by a lag ‘h’ – pattern filling approach • Linear Stochastic in nature – makes no recognition of deterministic nature of data (the physics) (treats uncertainty as irreducible) • Simplifies spatial pattern manifested by complex interactions between geology and time-sensitive fluid flow dynamics. Arsenic in groundwater is not a purely random occurrence and that there exist distinct geological and geochemical factors controlling its variability. It is no longer defensible to continue to use pure geo-statistical approaches of pattern filling as stand-alone techniques for its spatial interpolation in resource poor settings that are typical of developing nations.
Chaos Theory as an Alternative Approach • Why Chaos Theory?: • Evidence for a number of ‘hypotheses’ on arsenic contamination have been observed in Bangladesh. • Opinion Poll by Akmam (2002) revealed lack of a unifying theory: • 58% support for Oxy-Hydroxide Reduction hypothesis; • 33% support for Pyrite Oxidation hypothesis; • 75% support groundwater extraction causes arsenic release; • Each hypothesis can be represented as a sum of at least 3 partial differential equations – necessary condition for phenomenon to exhibit ‘Chaos’ • Chaos theory is based on non-linear deterministic theory and can potentially bridge the gap between mechanistic understanding (physics) and pure stochastic modeling (data-based). • Correlation Dimension (CD) is one measure of chaos – Grassberger-Procaccia Algorithm.
Evidence of Chaos in Arsenic data in Bangladesh: Correlation Dimension Analysis • Hossain and Sivakumar (2006), Stochastic Env. Res. and Risk Analysis – demonstrated Chaos in Arsenic spatial variability using BGS data. • Correlation Dimension of 8-10observed. Embedding Dimension of 10-12. • Arsenic contamination in space, from the chaotic point of view, is a medium- to high-dimensional problem. The Hénon map is given by: x(t) = a + b * y(t-1) – x(t-1)^2 y(t) = x(t) ; a=1.4, b=0.3. Deterministic Randomness Hypothesis- At least 8 variables/dimensions needed to optimally model spatial variability ‘deterministically’
Assessment of Correlation Dimension Is Correlation Dimension a Reliable Proxy for the Number of Dominant Influencing Variables for Modeling Risk of Arsenic Contamination in Groundwater? 1. Using Ordinary Logistic Regression Models, the value of CD as a proxy was assessed: ln[p/(1-p)] =logit (p) = α + βx Where, p = probability of a well exceeding a concentration limit; x=vector of influencing variables; α is a constant, β is a vector of slope coefficients 2. INFLUENCING VARIABLES? – CD does not inform on the choice but only the ‘optimal’ number of variables in a deterministic model
Assessment of Correlation Dimension All possible combinations of LR models considered – 2048 combinations Uncertainty associated with prediction of wells as safe and unsafe by LR modeldeclines systematically as the total number of influencing variables increases from 8 to 11. Sensitivity of the mean predictive performance also increases noticeably for this range.
Part Three VISION FOR THE FUTURE
The Future of GW Contamination Mapping in Rural Settings Where are we right now? Linear Geostatistical techniques – two-point only correlation, smoothing filter, misses local hot spots, treats contaminant as a pure random variable with no regard for the physics behind the spatial variability Chaos-based non-linear models –does not treat contaminant as a pure random variable; deterministic randomness can be quantified; Correlation Dimension appears to have merit as a proxy in deterministic models; but does not prioritize influencing variables Can we use current arsenic geochemistry knowledge to prioritize influencing variables in chaos-based non-linear models? Can chaos-theory be a bridge between linear stochastic techniques and contamination physics? Can we use multiple point techniques?
New Paradigm for Spatial Mapping • Combines two paradigms: Geostatistical Paradigm and Chaotic Paradigm • Geostatistical Paradigm– Pattern Filling (Kriging – and/or conditional simulation) • Chaos Paradigm– Pattern Recognition (number of variables defining spatial variability) – Physics-based • Combining both may increase success rate of identifying unsafe wells (reducing false hopes). Success Ratio (Geostatistics.AND.Chaos Theory) IS GREATER THAN Success Ratio (Geostatistics.OR. Chaos Theory) ? Implications for *any* contaminant variable and other rural regions – Southeast Asia, Mexico, South America – probably the US
1.Arsenic Geochemistry & Transport Mechanism Advanced Mapping Scheme In-situ Sampling Indicator Kriging /Simulation method 2. Non linear Deterministic Dynamics CD analysis of Arsenic spatial variability 3. Multiple point Correlation Functions General Formulation of Our Mapping Scheme • Theoretical formulation recognizes explicitly the complex fluid flow patterns through multiple connection statistics • Mapping scheme explicitly integrates the dominant physical knowledge in the parameterization of the chaos-based models Calibration data requirement should stay invariant Integration of techniques is Bayesian and treated as a priori for indicator simulation
The Future of Mapping in Rural Settings • Agenda – what is needed to move forward? • Greater Collaboration with community engaged in mechanistic understanding of arsenic contamination(geologists, soil geochemist, groundwater hydrologists etc) to identify ‘influencing variables’ and integrate them physically in chaos-based mapping schemes. • Assess enhanced geostatistical methods –Conditional Indicator Simulation • Address the transient nature of the problem –leverage realtime environmental monitoring network • Implement the proposed scheme (and paradigm) in real-world using limited sampling data. • Search for ways to generalize the approachfor any contaminant variableunder a resource-poor setting for a developing country.
SALIENT POINTS (Current Progress Report) • Typical Field Kits used in Bangladesh have large false positives and negatives (25%-80%). Social survey indicates villagers willingness to ‘walk/pay’. • Mainstream linear geostatistical methods for spatial mapping are inadequate for locating local scale hot spots/variability at scales < 50 km. • Mainstream geostatistical methods smoothen the complexities of contamination and should be augmented with enhanced methods. Examples are: non-linear chaos, multi-point and indicator kriging. • Arsenic contamination exhibits clear deterministic dynamics in spatial pattern – sensitive to geology. • Correlation Dimension analysis indicates 8 or higher influencing variables needed to spatial model variability optimally. • Correlation Dimension has information value as a rapid proxy (at least for Logistic regression). • As a path forward, greater collaboration is now needed with community on mechanistic understanding of contamination to bridge the gaps between mapping scheme and integration of physics in the interpolation.
Relevant Publications (available at iweb.tntech.edu/fhossain/publications.html) 1.Hossain, F., A.C. Bagtzoglou, N. Nahar* and M.D. Hossain. (2006). Statistical Characterization of Arsenic Contamination in Shallow Tube wells of Western Bangladesh. Hydrological Processes. vol. 20(7), pp. 1497-1510 (doi:10.1002/hyp.5946). 2. Hossain, F. and B. Sivakumar. (2006). Spatial Pattern of Arsenic Contamination in Shallow Tubewells of Bangladesh: Regional Geology and Non-linear Dynamics Stochastic Environmental Research and Risk Assessment , vol 20(1-2), pp. 66-76 3. Hossain, F. and B. Sivakumar (2007). Spatial Interpolation of Contaminantion based on Linear and Non-linear Paradigms for Developing Countries, Stochastic Environmental Research and Risk Assessment (Revised and in review). 4. Hossain, F., A.J. Hill, and A.C. Bagtzoglou (2006). Geostatistically-based management of Arsenic Contaminated Ground water in Shallow wells of Bangladesh. Water Resources Management. (In press, doi: 10.1007/s11269-006-9079-2) 5. Hill, A.J., F. Hossain and B. Sivakumar. (2006). Is Correlation Dimension a Reliable Proxy for the Number of Influencing Variables required to Model Risk of Arsenic Contamination in Groundwater? Stochastic Environmental Research and Risk Assessment, (In press; doi: 10.1007/s00477-006-0098-6). 6. Nahar, N., F. Hossain, and M.D. Hossain (2007). Health and Socio-economic Effects of Groundwater Arsenic Contamination in Rural Bangladesh: Evidence from Field Surveys, International Perspectives Journal of Environmental Health. (Provisionally accepted) 7. Rahman, S., and F. Hossain . (2007). A Forensic Look at Groundwater Arsenic Contamination in Bangladesh, Environmental Forensics. 8(4), December (In press)
Acknowledgements • Center for Management, Protection, Utilization of Water Resources, Tennessee Technological University (TTU) • Department of Civil and Environmental Engineering, TTU • Office of Sponsored Research, TTU • Ministry of Environment, Bangladesh • Institute of Water Modeling, Bangladesh (5-year MOU with TTU) • Bangladesh Council for Scientific and Industrial Research (BCSIR) • British Geological Survey and Department of Public Health, Bangladesh • Asia Arsenic Network (Japan) • Rajshahi University, Bangladesh • And many other friends and colleagues
Thank You! “When a large portion of the rural population continues to suffer from the arsenic calamity, we, the more fortunate ones with time to brainstorm, have the responsibility to critically assess any novel idea until a long-term structural solution is in the horizon. “ Questions?