Download

1 / 50
500 likes | 583 Views
Explore the historical development of electrical grids, pioneers in power generation, regulatory acts, and modern challenges. Learn about transmission grids, regulatory policies, and optimizing power generation mix. Understand the costing of power in terms of fixed and variable costs.

E N D
Housekeeping Issues • HW2 due today, HW3 posted in Bb (due 2/1) • Talking of 2/1, visit to Energy center on 2/1 at class time.
Pioneers • Electricity known since ancient times • But in the form of static electricity, mostly • “capacitor” (Leyden Jar), about 1745 • Galvani (1780), Volta(1791) : electrochemical batteries • Faraday • Electric motor in 1821 (electricity goes from curiosity to possibly useful principle) • Also, Faraday’s law (emf generated by moving conductor through magnetic field) • Maxwell & Pixii: DC dynamo in 1832
Pioneers • Batteries • Grove, Fuel cell in 1839 • Plante, Lead-Acid in 1859 • Leclanche, Zinc-Manganese battery (“dry cell”) in 1866 (NiCd in 1899, NiMH in 1970s, Li-ion in 1980s) • Siemens and Wheatstone • Modern generator (using electromagnets) in 1867 • Edison & Swan • Incandescent lamp in 1879 (electricity could be useful to the citizenry in general)
Pioneers • Edison • Pearl Street DC power station, 1882 • Edison Electric Light Company • Gaulard & Gibbs: Transformer, 1883 • Westinghouse: Westinghouse Electric Company, 1886 • Tesla: Induction motor and polyphase AC systems, 1888 • Parson: steam turbine in 1889 (enabled thermal power station)
Pioneers • Portland, Oregon • First single-phase AC transmission line in 1890 • 3.3 kV, 13 miles • Frankfurt, Germany • First 3-Phase AC transmission line in 1891 • 30 kV, 106 miles • Integration into a “grid” • US: Holdings companies integrated various generation and use in 1920s (e.g., Samuel Insull) • UK: Central Electricity Board in 1926 (by 1934 140 power stations integrated)
Regulation in US • Public Utility Holding Company Act (PUHCA), 1935 • Consequence of Samuel Insull highly leveraged utility holding company collapse (ENRON-like) • Utilities can only serve limited geographic area • Cannot have “vertically integrated monopoly” (e.g., power companies cannot own electric street car companies) • Public Utilities Regulator Policies Act (PURPA), 1978 • increasing fossil-fuel prices, inflation, calls for conservation and growing environmental concerns in 1970s • Mandated power purchase by utilities from independent generators located in their service territory (added renewables) • Introduced some competition, results varied greatly by state
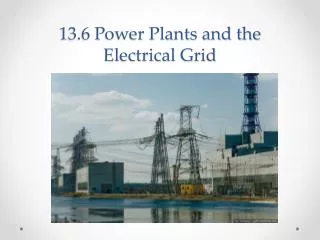
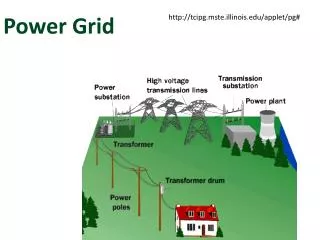
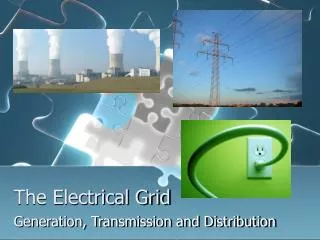
TRANSMISSION GRID • After the first U.S. blackout of 1965, North American Electric Reliability Council (NERC) formed 10 regions to coordinate efforts that will assure reliability and adequacy of service of the U.S. grid • Power is transmitted in U.S. in two forms • AC – most three-phase ac • DC
Regulation (cont) • Clean Air Act in 1990 • Mandates emissions controls (in particular SO2) • National Energy Policy Act of 1992 • Mandated that utilities provide “nondiscriminatory” access to the high voltage transmission • Goal was to set up true competition in generation • Repealed by Energy Policy Act of 2005
Regulation (cont.) • U.S.A. • National Energy Policy Act (EPAct) in 1992 • California • Begins restructuring towards a competitive market in 1998 • Restructuring collapses in 2001
Power Consumption in US TWh = Billion kWh
LOADS Can range in size from less than one watt to 10’s of MW Loads are usually aggregated for system analysis The aggregate load changes with time, with strong daily, weekly and seasonal cycles Load variation is very location dependent
INDUSTRY STATISTICS • The electricity equation has two sides • Supply Side • Demand Side • The following figure shows the California power demand on a hot summer day • Some areas are summer peaking (U.S.) • Some areas are winter peaking (Canada)
Baseload, Intermediate and Peaking Supply • Load demand on utilities fluctuates constantly • During peak demand most plants are operating • During light demand many plants are idling • Power plants are categorized as • Baseload • Large coal, nuclear, and hydroelectric plants • Expensive to build, cheap to operate • Intermediate • Combined-cycle plants • Cycled up during the day, cycled down during the evening • Peaking • Simple-cycle gas turbines • Inexpensive to build, expensive to operate
Optimizing Power Generation Mix • How do you find out the optimal mix of generation? • What’s the best model? • Economic? • Efficiency? • Other? • Current answer is “economic”, of course
Costing Power Costs in two main categories • Fixed costs (Money you need to bring in even if plant is never turned on) • Capital cost • Taxes • Insurance • Fixed operation and maintenance costs • Variable costs (Cost associated with running the plant) • Fuel • Operation and maintenance (O&M)
Financial concepts • Initial cost • One time expense incurred at beginning of project • Construction, capital equipment purchase, etc • Term of Project • Time length over which cash flow of project must be considered. • Usually divided into years (say N years) • Annuity • Annual increment of cash flow related to the project • Salvage value • One time positive cash flow at end of project • Sale of assets, systems, etc • Usually very small compared to initial costs
Project Evaluation Without Discounting Primitive method of project evaluation • Calculates “Net Present Value” (NPV) • Sum of all cash flows into and out of project • E.g., Initial Costs (-), Annuities (+), Salvage (+) • Since goal of most projects is to make money, NPV>0… • For such a project, the Annual Capital Cost (ACC) is • And the Capital Recovery Factor (CRF) is • In general, it is recommended that CRF≤12%
Net Present Value Example But we have $500 salvage value so NPV=-$500+$500=$0 Initial Cost = $10,000 So at start NPV=-$10,000 On year 5 NPV=-$10,000+5x$1,900=-$500 Annuity = $1,900 So on year 1 NPV=-$10,000+$1,900 =-$8,100 Year 5 Beginning of Project “Year 5”
Example Say a municipality plans to invest in a renewable energy system costing $6.5M to install, generate a net annuity of $400k for 25 years and have a salvage value of $1M What is a) Term of Project; b) Initial Cost; c) Annuity; d) Salvage? e) What is NPV of project at end? f) Does this project appear cost effective? 25 years $6.5M $400k $1M NPV= -$6.5M + 25x$400k + $1M = $4.5M
Discounting A factor that builds into the annuity the concept that the value of money declines over time Includes: • Interest rate (discount rate) • Percent charged on initial costs borrowed at the beginning of a time horizon • Unless otherwise stated, usually compounded at the end of the year • Minimum attractive rate of return (MARR) • The minimum interest rate required for returns on a project in order for it to be financially attractive • Set by entity (business, government agency, etc) making decision by looking at competing projects
Including Effect of Discount Rate on Value In general, given an interest rate i and a time horizon of N • The future value of an amount P is • Given a stream of annuities A, the future value F of the annuities at the end of the Nth year is • Call these (F/P, i, N) and (F/A, i, N)
Example 2: Project Evaluation With Discount Given Initial Cost = $6.5M, N=25 years, A=$400k, Salvage Value=$1M, i=5% is the project economically feasible? Clearly, we must reduce all value to one point. Let’s chose the end of the project (end of annuity 25 and salvage) 1-Calculate future value factor of initial cost (F/P, 5%, 25): 2-Calculate future value factor of annuity
Example 2 (cont.) At end, salvage does not need to be adjusted for time… Then, 3-Calculate future value of project What does this mean? -Simple payback analysis gives a poor answer… -Even at apparently low MARR projects cost more than they appear to!
Necessary Annuity to cover capital costs Given that the financial return to investors is built into MARR, the final value of the project needs to be ≥ 0 Then For the previous example,
Costing Power • Other fixed costs • Regular maintenance (e.g., groundskeeping) • Administration • Insurance • Variable Costs (primarily fuel) • Cost of fuel • Coal ~ $2.21/MMBTU ($43.74/ton) • Gas ~ $4.74/MMBTU • Operations and Maintenance (Repair & Spare parts, etc) Variable Costs ($/yr) = [ Fuel($/BTU)xHeat rate(BTU/kWh) + O&M($/kWh)] xkWh/yr
Costing Power - II Total cost of operating power plant then is the sum: Then, depending on how many kWh are generated in a typical year, This levelized cost per unit of energy is useful to compare various projects
New Generation Costs Summary Adapted from EIA publication Electricity Market Module of the National Energy Modeling System 2010, DOE/EIA-M068(2010)
Capacity Factor The capacity factor is defined as CF = [produced energy per year (kWh/yr)] / [ Rated power (kW) x 8760 h/yr] Essentially “fraction of plant on-line time at full power averaged over year” Why would the plant not operate at full rated power for full year? 1-Time down for maintenance (try to minimize this…) 2-Power it produces is not cost effective (use screening curve to find out how many hours on-line)
Screening Curve • Plot costs for different plants on the same graph Plot as Cost = Fixed Cost ($) + Variable Cost ($/kWh) *kWh Cost ($) Variable Costs Plant 2 Fixed Costs Plant 2 Fixed Costs Plant 1 ($) Variable Costs Plant 1 ($/kWh * kWh) Energy Produced (kWh) [or rated power (kW) x hours of operation (h)]
Using Screening Curves Combustion turbine is lowest-cost option for up to 1675 h/yr of operation Coal plant is the lowest-cost option for operation beyond 6565 h/yr The combined cycle plant is the cheapest option if it runs between 1675 and 6565 h/yr
Determining Optimum Mix Transfer crossover points onto load duration curve to identify optimum mix of power plants
Determining Optimum Mix Peaking + Reserve Intermediate Baseload
Cost of Power • The CF with cost parameters from the following table allow us to determine the cost of electricity from each type of plant
Costing Power – Final Remarks • Load duration curve needs to be padded with reserve excess capacity (reserve margin) • To deal with plant outages, sudden peaks in demand, and other unforeseen events • Process of selecting which plant to operate first at any given time is called dispatching • If you have renewables, they will be dispatched first, although they are intermittent (and require extra spinning reserve) • Energy Policy Act 1992/2005
New Generation by Fuel Type(USA 1990 to 2030, GW) Source: EIA Annual Energy Outlook 2007