Download
1 / 43
430 likes | 570 Views
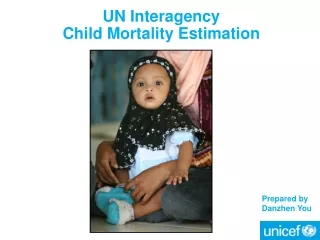
Child Mortality Estimation Harmonization Prospects Edilberto Loaiza Bangkok, January 15, 2009 ESCAP workshop on MDG monitoring. What is the main issue?.

E N D
ChildMortality EstimationHarmonization ProspectsEdilberto LoaizaBangkok, January 15, 2009ESCAP workshop on MDG monitoring
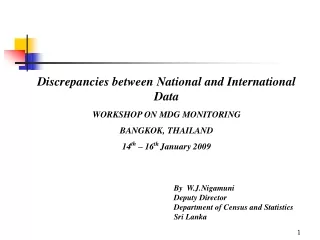
What is the main issue? Often data produced and used at the country level is different from the one produced and used at the global level. This has been observed more recently during the UNICEF yearly reporting on the State of the World’s Children and in particular the reporting of the under five mortality indicator
What are exactly the main issues? • Discrepancies occur at different levels and moments in the harmonization cycle • Between UNICEF offices (HQ-RO-CO) • Between International Organizations (IO) • Between IO and Governments • How to deal with these issues? • Inter Agency Work and Coordination!!
Harmonization Cycle Data collection Data compilation Data analysis and methodological work Data use and dissemination Statistical capacity building Data used for evidence-based programming
Reasons for the differences • Different data sources: vital registration, population census, household surveys, sample registration systems or a combination of them • Different methods of calculation for IMR and U5MR • Different methods of estimation when combining data sources and methods • Reference year to which the estimates correspond and when the estimates are produced (usually in June for UNICEF but published in November)
The reality of child mortality estimates • The majority of child mortality occurs in countries without adequate vital registration systems - hence use has to be made of alternative sources, primarily household surveys and censuses. • How do these data sources look like graphically, and what might be the derived mortality estimates?
The Inter-agency Group for Child Mortality Estimation (IGME) • Initiated by UNICEF, WHO, The World Bank and the United Nations Population Division • To work on data sources and methodologies used for child mortality estimation • To produce agreed estimates of infant and under five mortality estimates at the country level • Harmonize and disseminate the work and results • Child mortality data base (CMEInfo, a DevInfo application) • Regional workshops
For estimation purposes the work aims to.. • Compile all nationally representative data sets on child mortality • Fit simple (objective, transparent) model of an indicator of child mortality (typically U5MR) on time • Extrapolate as necessary to required target date • Derive time series of multiple child mortality indicators (IMR) using life-table models
Using…. • Compiled data and estimates from vital registration, national censuses and surveys from 1960 onwards • A number of data sets that varies by country • Data of different quality within and between country and survey • Not always standard time series: observations are unevenly spaced, gaps, overlap
Data Types • Vital registration if available provides (annual) series of Infant Mortality Rates • Birth histories (WFS and DHS surveys) provide “direct” estimates of Infant Mortality Rate (IMR) and Under-Five Mortality Rate (U5MR), typically for periods 0 to 4, 5 to 9 and 10 to 14 years before survey • Summary birth histories (WFS and DHS surveys, other household surveys such as MICS, NHS and population censuses) provide “indirect” estimates of U5MR for six time points covering roughly the period 2 to 12 years before the survey
Data Problems • Sampling errors (surveys only) • Omission of deaths • Misreporting of child’s age at death or date of birth (direct only) • Selection biases • Violation of assumptions (indirect only)
Approaches • SPLINE • LOESS
SPLINE: Weighted Least Square with Variable Slope • The model used is: • Date is calendar year • Postkj = (date - dateknotj) if (date-dateknotj) is positive = 0 if (date-dateknotj) is negative • The knots are defined backward into the past and each time the sum of the weights reaches a multiple of 5 • Thus number and location of knots is data-driven
Smoothing • Basic idea is to use weighted least squares regression of ln(U5MR) on time, with weights that reflect priors about data quality • Data errors (and thus weights) may be characteristic of.. • A data set (e.g. a bad survey affecting all points) • A type of observation (e.g. an indirect estimate based on reports of women aged 15 to 19 [selection bias] or a direct estimate based on reported births 10-14 years before the survey [recall lapse])
Standard Weights When both direct and indirect estimates are available, weights are halved
Methods: Weighted Least Square with Variable Slope • Fit a model of log(q5) to time Fixed slope Splines with variable slopes (5 knots)
Underweighting a data set • The weights are modified if one data set appears to be an outlier WFS ‘79 WFS ‘79 WFS 79 WFS 79 Standard weights Weighting 1979 WFS to zero
LOESS Smoothing • LOESS stands for Locally Weighted Least Squares • Value of fitted line at a given point is determined by a regression line, weighting observations by function of distance from point • Key parameter is α, the bandwidth or range of observations included • Exclusion of “outliers”, as with Spline
LOESS Smoothing (continued) Function estimated is log(y) = β0 + β1(x) + β2(z) + ε Where y is U5MR, x is date and z is a dummy variable indicating whether the observation is from civil registration • Selection of α: • Range from 0.05 (or smallest value that captures at least 3 points) to 2.0 (or largest value that allows some variability) Uncertainty: 1,000 draws per value of α
Loess: What Does α Do? Small α fits many small local regressions, averages results Large α fits few wider regressions, averages results Small α Big α Note log scale on y axis
Smoothing U5MR Simple regression of log(U5MR) on Date of Observation:
Smoothing U5MR Loess regression of log(U5MR) on Date of Observation, α = 0.1:
Smoothing U5MR Loess regression of log(U5MR) on Date of Observation, α = 0.4:
Smoothing U5MR Loess regression of log(U5MR) on Date of Observation, α = 1.0:
Smoothing U5MR Are there any data sets we should exclude? DHS 1987 (direct) 1990 Census 1980 Census
Smoothing U5MR Loess regression of log(U5MR) on Date of Observation, α = 0.4, Dropping observations from 1980, 1990 censuses and 1987 DHS Direct
Major Differences: Spline vs. Loess • As implemented, Loess smooths series more strongly than Spline (high values of αpredominate) • Loess provides more stable forecasts • Within range of observations, differences tend to be small
Comparison of Spline- and Loess-based approaches for the estimation of child mortality Richard Silverwood and Simon Cousens London School of Hygiene and Tropical Medicine 16th April 2008
Levels and Trends of Child Mortality in 2006[Working Paper] Estimates developed by the Inter-agency Group for Child Mortality Estimation http://www.childinfo.org/areas/childmortality/methodology.php
The child mortality data base • A DevInfo application • www.childmortality.org • The idea is for countries to become users for data entry, assessment, estimation and dissemination • Training to be implemented via regional workshops
Regional workshops for coordination and capacity building • Started in September 2008 in Bangkok • One week training for Maternal Mortality and Child Mortality • Workshop for LAC (March 2009) • Representatives of MOH and NSOs • Review of data sources, methodologies, and estimation procedures • Hands-on training
Focal point for CM estimation in New York Edilberto Loaiza eloaiza@unicef.org. Tel. 212-326 7243 QUESTIONS?