Download
1 / 1
10 likes | 180 Views
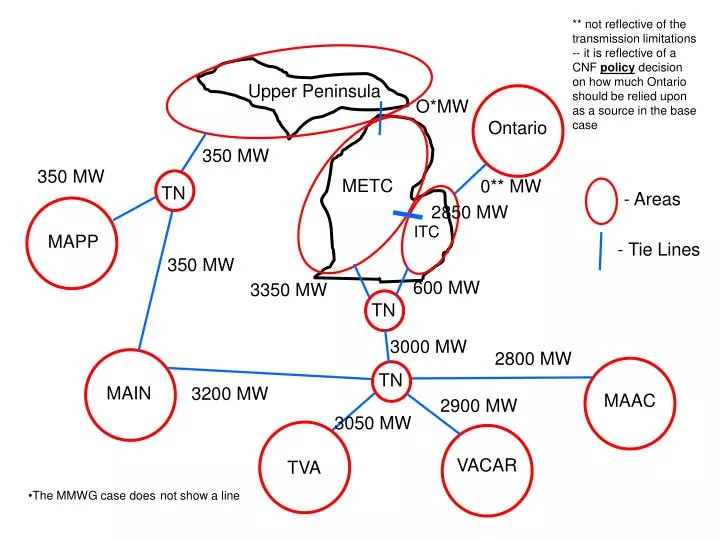
- Areas. - Tie Lines. ** not reflective of the transmission limitations -- it is reflective of a CNF policy decision on how much Ontario should be relied upon as a source in the base case. Upper Peninsula. O*MW. Ontario. 350 MW. 350 MW. 0** MW. METC. TN. 2850 MW. ITC. MAPP.

E N D
- Areas - Tie Lines ** not reflective of the transmission limitations -- it is reflective of a CNF policy decision on how much Ontario should be relied upon as a source in the base case Upper Peninsula O*MW Ontario 350 MW 350 MW 0** MW METC TN 2850 MW ITC MAPP 350 MW 600 MW 3350 MW TN 3000 MW 2800 MW TN 3200 MW MAIN 2900 MW MAAC 3050 MW VACAR TVA • The MMWG case doesnot show a line