Download
1 / 34
340 likes | 508 Views
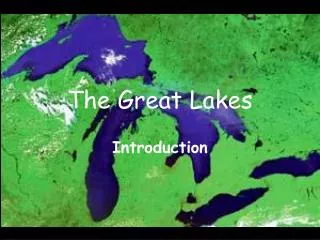
Great Lakes Offshore Biological Desert and the Nearshore Slime Around the Tub. David Rockwell Monitoring Indicators and Reporting Branch US EPA, Great Lakes National Program Office. Methods. Great Lakes National Program Office Annual monitoring cruises, 1983-2005 Spring unstratified (April)

E N D
Great Lakes Offshore Biological Desert and the Nearshore Slime Around the Tub David Rockwell Monitoring Indicators and Reporting Branch US EPA, Great Lakes National Program Office
Methods • Great Lakes National Program Office • Annual monitoring cruises, 1983-2005 • Spring unstratified (April) • Summer stratified (August)
GLNPO Biology Program Measures • Phytoplankton • Community Composition, Biomass • Deep Chlorophyll Maximum • Historical Communities • Crustacean Zooplankton and Benthos • Community Composition • Size Structure of Community
GLNPO Sampling Stations Different colors indicate regions assumed to be homogeneous
Methods • 1984-1990: • Tows B-2 m • 63 mm mesh net with flowmeter • Biomass calculated from avg. length/spp generated from 20 m tows • 1998-2005 • 100 (or B-2 m) tows • 153 mm mesh net with flowmeter • 20 individuals/spp measured/sample
Zooplankton Communities in Lake Huron 1984-2005 Mary Balcer Richard P. Barbiero University of Wisconsin-Superior CSC, & Loyola University Chicago
Cladocerans Copepods #3 #1 Cyclopoid copepod Daphnia #2 Diaptomid copepod Bosmina Bosmina Limnocalanus
Size distribution of crustacean biomass South Basin North Basin
Lake Huron and Lake Superior Zooplankton Communities Superior central basin Huron northern basin Limnocalanus macrurus Diaptomus sicilis
Phosphorus Loading Trends Recent Loads Dolan and McGunagle 2005 Superior GLWQA Target Erie Michigan P Load (tonnes yr-1) Ontario Huron
Total Phosphorus Trends (Spring) Harvey Bootsma SOLEC 2006 Superior GLWQA Target ♦ Environment Canada ♦ USEPA-GLNPO ■ ■ Erie Central Ontario Michigan TP (mg L-1) Huron
Plots of simulation results and data for TP (gP/L) in the Upper Great Lakes: (a) Superior, (b) Michigan, and (c) Huron. The water-quality objectives are shown as dashed lines. (RWG D Annex 3 Technical Subgroup Report DePinto et al 2006) • Schematic of a long-term, total phosphorus model for the Great Lakes (Chapra 1977).
Nearshore Shunt Hypothetical ConstructHecky et al 2004 Can.J. Fish Aquat. Sci 61
Secchi disk depths near Milwaukee, Lake Michigan Dr. Harvey Bootsman, SOLEC 2006 Mussel invasion Data provided by MMSD Data source: MMSD
Lake Erie Total Phosphorus, ug-P/LPre(1983-1989)/Post (1990-2004)
Lake Erie Total Dissolved Phosphorus, ug-P/LPre(1983-1989)/Post (1990-2004)
Figure courtesy of Dr. Peter Richards, Heidelberg College DRP/TP Maumee Cuyahoga Sandusky Grand
Sandusky and Maumee River Watersheds Lake Erie Figure courtesy of Dr. Peter Richards, Heidelberg College
P in Wisconsin Cropland Average [P] (ppm) Bundy and Sturgul 2001
Long-term Influence of Soil P on Lake P Soil P inputs reduced after year 250 Soil [P] Sediment [P] P Inputs to Soil (g m-2 y-1) Phosphorus Density (g m-2) P Input to soil Water [P] Years Source: S.R. Carpenter, 2005
P in Wisconsin Cropland Average [P] (ppm) Soil P Storage Change (kg ha-1) Bundy and Sturgul 2001
Long-term Influence of Soil P on Lake P Soil P budget balanced at year 250 Soil [P] Sediment [P] P Inputs to Soil (g m-2 y-1) Phosphorus Density (g m-2) P Input to soil Water [P] Years Source: S.R. Carpenter, 2005
Summary • Offshore Declines in Zooplankton Biomass are observed Lake Huron. • Phosphorus loads and open lake phosphorus concentrations have declined in the Great Lakes in response to controls • Top down effects are observed to contribute to decline in the lower food web. • Nearshore Cladophora increases appear to be link to Dreissena invasion via increased water clarity and cycling of nutrients • Total phosphorus loading has increased soluble fraction and open lake concentrations in Lake Erie have a significant increase in soluble fraction in the spring. • Total phosphorus concentrations in the Upper Great Lakes appear to below levels modeled to exist in 1800.
Dissolved Reactive Silica increases in Lakes Michigan and Huron are linked to TP declines. • Dissolved Reactive Silica increases in Lake Erie are linked to predation by Dreissena • Nearshore shunt of nutrients redirected to the nearshore zones of the Lakes contributing to the reemergence of Cladophora while offshore P concentrations remain low. • Continued addition of P to soils may pose a challenge to the lakes well into the future. • In the nearshore zone, increased water clarity has altered the relationship between P supply and algal abundance. • More P abatement would benefit the nearshore zone, but would it benefit pelagic zone?