Download
1 / 30
390 likes | 634 Views
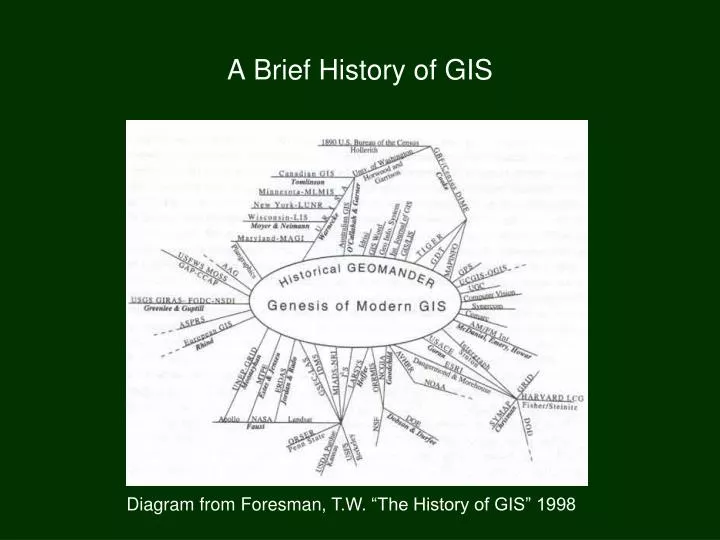
A Brief History of GIS. Diagram from Foresman , T.W. “The History of GIS” 1998. A Brief History of GIS. Some early spatial thinkers: Ptolemy – Greek philosopher/geographer/astronomer – A main work: Geographia (150 AD)

E N D
A Brief History of GIS Diagram from Foresman, T.W. “The History of GIS” 1998
A Brief History of GIS • Some early spatial thinkers: • Ptolemy – Greek philosopher/geographer/astronomer – A main work: Geographia(150 AD) • Kant – German philosopher – Puzzled by how spatial info. (color, texture) reaches brain (1700s) • Berthier – Hinged-overlay maps of Yorktown (1790s) • Irish Railway Commission – Overlay maps with shaded circles (1830s)
death A Brief History of GIS 1854 – John Snow’s cholera mapping study: “I found that nearly all the deaths had taken place within a short distance of the pump."
A Brief History of GIS • Herman Hollerith and automation • 1880 – Turing or tabulating punch-card machine • 1880 Census took 8 yrs. to tabulate, 1890 1 yr. • His dissertation (1889) was titled: “An Electric Tabulating System”
A Brief History of GIS City and resource planning • 1912 - Dusseldorf, Germany time-series maps • 1912 - Billerica, MA traffic/land use mapped • 1912 - Wm. Manning, same scale thematic overlay maps • 1929 - New York, NY “Survey of NY and Environs” • 1950s - Univ. of WA students develop spatial statistics • 1959 - Waldo Tobler applies computer to mapping • 1962 - Mass. Inst. of Tech., overlays with weighting • 1960s - USGS and Soil Cons. Service • 1960s - FORTRAN language used to draw maps
A Brief History of GIS • Topology, a major milestone • James Corbett’s streamlining of 1970 census • Corbett developed the “topology” concept • Presented a paper on topology in 1967, published in 1979* • DIME and then Census TIGER files > adoption of digital mapping by Govt. • Still the core of modern vector data files (e.g., DLG, GEOpdf) * Corbett, James P. 1979. Topological Principles in Cartography. Washington, DC: Bureau of the Census.
A Brief History of GIS • Canada Geographic Information System (CGIS), a major milestone • 1958 - Canadian Senate est. Land Use in Canada group • Dr. Roger Tomlinson (FATHER OF GIS?) was asked to map all of Canada’s landcoverfor agriculture, wildlife, forestry, and recreation • 1966 - CGIS was created • 1971 - the first computer-based GIS was operational • - firsts: optical scanning of maps, raster to vector conversion, spatial database management system (attributes and locations in different files), seamless tiles, polygon query • Fundamental new idea – computers are now used to ask questions of maps, to read maps, and to measure, compare, combine, and analyzed map data
A Brief History of GIS • Environmental Systems Research Institute (ESRI), a major milestone • “One of the biggest shifts in focus came when we introduced ArcInfo in 1982. • With the release of a strong product, we began to leverage all of our project experience into a product that would help other organizations do what we did in our project efforts. This changed everything.” Jack Dangermond president and founder, ESRI
A Brief History of GIS • The Virtual Globe ‘Google Earth’, a major milestone • Started by a company named Keyhole, which was acquired by Google in 2004. • “By offering researchers an easy way into GIS software, Google Earth and other virtual globes are set to go beyond representing the world, and start • changing it.” • “The eventual impact will be nothing less than the realization of a ‘Digital Earth’, as described by former US vice-president Al Gore in 1998.” • (both quotes from ‘The Web Wide World’, 2006)
Next: Cartography basics • Scale • Datums • Projections • Coordinate systems
Map Scale Less “zoomed in” More “zoomed in” Smaller scale Larger scale Smaller fraction Larger fraction image from: http://rockyweb.cr.usgs.gov/outreach
Map Scale • 1:1,000,000 example? • 1:12,000 example? • 1:1 example? • 10:1 example? • 1,000:1 example?
Map Scale Three common ways to express map scale: • representational fraction • verbal scale • graphic scale bar
Datums Datum: an imaginary surface to which ground control measures are referred. “Datums define the size and shape of the earth and the origin and orientation of the coordinate systems used to map the earth.”- Peter Dana But first: What is the shape of the earth? • A perfect sphere ? • An ellipsoid or oblate spheroid ? • A geoid ?
Datums There are hundreds of datums + 250 other variations
Datums There are hundreds of datums > NGVD29 - National Geodetic Vertical Datum of 1929 > NAVD88 - North American Vertical Datum of 1988 Mountain NAVD 88 (NGVD 29) Borah Pk, ID 12,668 ft (12,662 ft) Gannett Pk, WY 13,809 ft (13,804 ft) Mt. Shasta, CA 14,179 ft (14,162 ft) Mt. Hood, OR 11,249 ft (11,239 ft) Mt. Wheeler, NM 13,167 ft (13,161 ft) HumpherysPk, AZ 12,637 ft (12,633 ft) Boundary Pk, NV 13,147 ft (13,140 ft) Mt, Rainier, WA 14,416 ft (14,410 ft) Kings Peak, UT 13,534 ft (13,528 ft) Mt. Elbert, CO 14,440 ft (14,433 ft)
Map Projections Purpose: to transfer info. from a spheroid to a flat surface
Some distortion always results from the projection process: Map Projections • Distorted scale • Distorted area • Distorted distance • Distorted shape • Distorted relative size • Distorted direction
Map Projections • Tangent: projection surface contact along one standard parallel only • Secant: projection surface passes through earth touching two standard parallels Image from: http://standards.iso.org/ittf/PubliclyAvailable
Coordinate systems • While map projections define how positions on the Earth’s curved surface are transformed onto a flat surface; coordinate systems superimpose a grid onto the projected surface (datum) to provide a referencing framework to measure location.
Coordinate systems False origin Easting Northing From: http://gis.washington.edu/esrm250/lessons/projection/
Coordinate systems • Common coordinate systems in US: • Universal Transverse Mercator (UTM) • Most common in US/Canadian mapping programs • Used by Army since ~1947; USGS since ~1967 • Long. zone #s designate 6 deg. strips from 80S to 84NLat. zones are 8 deg. N to S, labeled C to X • Lower 48 in 10 long. zones • In N Hemisphere, northing origin is EquatorIn S Hemisphere, northing origin is 10,000,000 at Equator • Easting (at 500,000 meters) is the center of zone • UTM shown on every 1:24K (1 km grid)
Universal Transverse Mercator (UTM) Coordinate System http://www.colorado.edu/geography/gcraft/notes/coordsys/coordsys_f.html
Universal Transverse Mercator (UTM) Coordinate System http://faculty.unlv.edu/jensen/CEE_468/img/UTM-NV.jpg
State Plane Coordinate System (SPCS) • Common coordinate systems in US: • State Plane Coordinate Systems • Developed by Coast Guard in 1930s • For state and county level mapping • 120 zones through states • Ignores earth curvature • Generally follows county boundaries • Northing and easting such that no neg. numbers • Problems: feet/meters, uses different coordinate systems for each zone, uses 3 different projections
State Plane Coordinate System (SPCS) http://www.ncdot.org/doh/PRECONSTRUCT/highway/location/support/Support_Files/Library_doc/graphics/1099figure3.gif
The Graticule Coordinate System • Common coordinate systems in US: • The graticule – Latitude and longitude
Summary: • Projections, coordinate systems, and datums determine how a GIS stores and displays spatial data. Knowledge of these topics is important in GES4050 (especially considering how many different sources of data we will assemble)