Download
1 / 24
270 likes | 469 Views
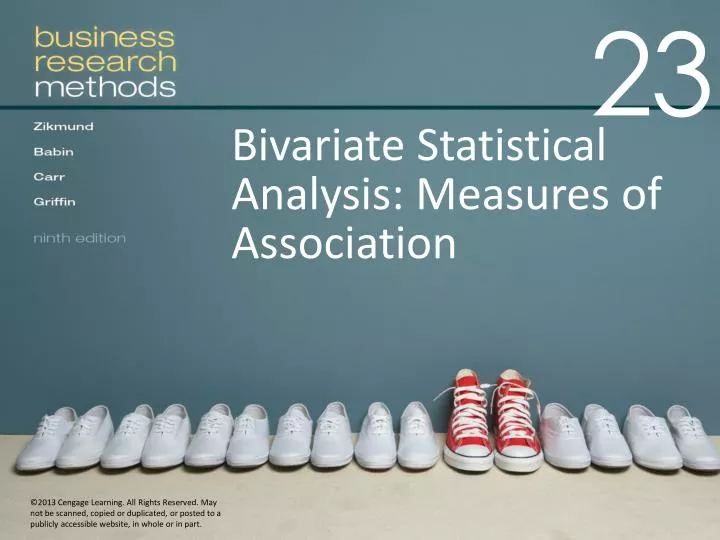
Bivariate Statistical Analysis : Measures of Association. Apply and interpret simple bivariate correlations Interpret a correlation matrix Understand simple (bivariate) regression Understand the least-squares estimation technique

E N D
Apply and interpret simple bivariate correlations • Interpret a correlation matrix • Understand simple (bivariate) regression • Understand the least-squares estimation technique • Interpret regression output including the tests of hypotheses tied to specific parameter coefficients
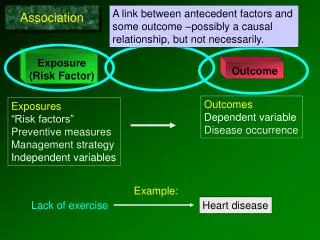
The Basics • Measures of Association • Refers to a number of bivariate statistical techniques used to measure the strength of a relationship between two variables. • The chi-square (2) test provides information about whether two or more less-than interval variables are interrelated. • Correlation analysis is most appropriate for interval or ratio variables. • Regression can accommodate either less-than interval or interval independent variables, but the dependent variable must be continuous.
EXHIBIT 23.1 Bivariate Analysis—Common Procedures for Testing Association
Simple Correlation Coefficient (continued) • Correlation coefficient • A statistical measure of the covariation, or association, between two at-least interval variables. • Covariance • Extent to which two variables are associated systematically with each other.
Simple Correlation Coefficient • Correlation coefficient (r) • Ranges from +1 to -1 • Perfect positive linear relationship = +1 • Perfect negative (inverse) linear relationship = -1 • No correlation = 0 • Correlation coefficient for two variables (X,Y)
EXHIBIT 23.2 Scatter Diagram to Illustrate Correlation Patterns
Correlation, Covariance, and Causation • When two variables covary, they display concomitant variation. • This systematic covariation does not in and of itself establish causality. • e.g., Rooster’s crow and the rising of the sun • Rooster does not cause the sun to rise.
Coefficient of Determination • Coefficient of Determination (R2) • A measure obtained by squaring the correlation coefficient; the proportion of the total variance of a variable accounted for by another value of another variable. • Measures that part of the total variance of Y that is accounted for by knowing the value of X.
Correlation Matrix • Correlation matrix • The standard form for reporting correlation coefficients for more than two variables. • Statistical Significance • The procedure for determining statistical significance is the t-test of the significance of a correlation coefficient.
EXHIBIT 23.4 Pearson Product-Moment Correlation Matrix for Salesperson Example
Regression Analysis • Simple (Bivariate) Linear Regression • A measure of linear association that investigates straight-line relationships between a continuous dependent variable and an independent variable that is usually continuous, but can be a categorical dummy variable. • The Regression Equation (Y = α + βX ) • Y = the continuous dependent variable • X = the independent variable • α= the Y intercept (regression line intercepts Y axis) • β = the slope of the coefficient (rise over run)
The Regression Equation • Parameter Estimate Choices • β is indicative of the strength and direction of the relationship between the independent and dependent variable. • α (Y intercept) is a fixed point that is considered a constant (how much Y can exist without X) • Standardized Regression Coefficient (β) • Estimated coefficient of the strength of relationship between the independent and dependent variables. • Expressed on a standardized scale where higher absolute values indicate stronger relationships (range is from -1 to 1).
The Regression Equation (cont’d) • Parameter Estimate Choices • Raw regression estimates (b1) • Raw regression weights have the advantage of retaining the scale metric—which is also their key disadvantage. • If the purpose of the regression analysis is forecasting, then raw parameter estimates must be used. • This is another way of saying when the researcher is interested only in prediction. • Standardized regression estimates (β) • Standardized regression estimates have the advantage of a constant scale. • Standardized regression estimates should be used when the researcher is testing explanatory hypotheses.
Ordinary Least-Squares (OLS) Method of Regression Analysis • OLS • Guarantees that the resulting straight line will produce the least possible total error in using X to predict Y. • Generates a straight line that minimizes the sum of squared deviations of the actual values from this predicted regression line. • No straight line can completely represent every dot in the scatter diagram. • There will be a discrepancy between most of the actual scores (each dot) and the predicted score . • Uses the criterion of attempting to make the least amount of total error in prediction of Y from X.
Ordinary Least-Squares Method of Regression Analysis (OLS) (cont’d)
Ordinary Least-Squares Method of Regression Analysis (OLS) (cont’d) The equation means that the predicted value for any value of X (Xi) is determined as a function of the estimated slope coefficient, plus the estimated intercept coefficient + some error.
Ordinary Least-Squares Method of Regression Analysis (OLS) (cont’d)
Ordinary Least-Squares Method of Regression Analysis (OLS) (cont’d) • Statistical Significance Of Regression Model • F-test (regression) • Determines whether more variability is explained by the regression or unexplained by the regression.
Ordinary Least-Squares Method of Regression Analysis (OLS) (cont’d) • R2 • The proportion of variance in Y that is explained by X (or vice versa) • A measure obtained by squaring the correlation coefficient; that proportion of the total variance of a variable that is accounted for by knowing the value of another variable.
EXHIBIT 23.8 Simple Regression Results for Building Permit Example
Simple Regression and Hypothesis Testing • The explanatory power of regression lies in hypothesis testing. Regression is often used to test relational hypotheses. • The outcome of the hypothesis test involves two conditions that must both be satisfied: • The regression weight must be in the hypothesized direction. Positive relationships require a positive coefficient and negative relationships require a negative coefficient. • The t-test associated with the regression weight must be significant.