Download
1 / 29
290 likes | 388 Views

E N D
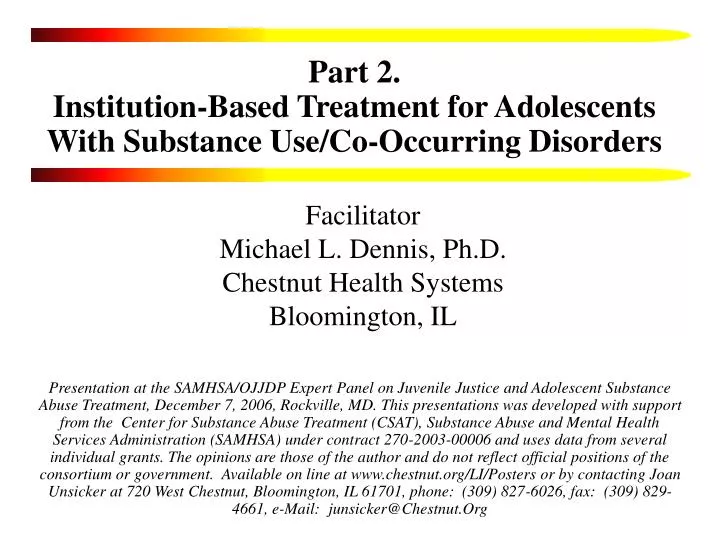
Presentation at the SAMHSA/OJJDP Expert Panel on Juvenile Justice and Adolescent Substance Abuse Treatment, December 7, 2006, Rockville, MD. This presentations was developed with support from the Center for Substance Abuse Treatment (CSAT), Substance Abuse and Mental Health Services Administration (SAMHSA) under contract 270-2003-00006 and uses data from several individual grants. The opinions are those of the author and do not reflect official positions of the consortium or government. Available on line at www.chestnut.org/LI/Posters or by contacting Joan Unsicker at 720 West Chestnut, Bloomington, IL 61701, phone: (309) 827-6026, fax: (309) 829-4661, e-Mail: junsicker@Chestnut.Org Facilitator Michael L. Dennis, Ph.D. Chestnut Health Systems Bloomington, IL Part 2. Institution-Based Treatment for Adolescents With Substance Use/Co-Occurring Disorders
The literature • In Lipsey’s (1997, 2001) meta analyses of juvenile delinquency literature and updated literature searches revealed no major randomized trials of adolescent substance abuse treatment in detention or other institutionalized juvenile justice settings • Lipsey’s meta analysis of juvenile justice institutional programs found that: • On average they had 5.6 distinguishable components • While the average program had little to no effect, the best quartile of programs reduced recidivism by 30% or more, • Could be predicted based on whether the program • Chose a strong intervention protocol based on prior evidence • Used quality assurance to ensure protocol adherence and project implementation • Used proactive case supervision of individual • Used triage to focus on the highest severity subgroup
Program components associated with average or better effects on recidivism No differences by race BETTER/BEST • Behavior management • Group counseling • Individual counseling • Interpersonal skills training AVERAGE OR BETTER • Family counseling • Cognitive-behavioral therapy • Employment/job training AVERAGE OR WORSE • “Scared Straight” and similar shock incarceration program • Boot camps mixed – had bad to no effect • Routine practice – had no or little (d=.07 or 6% reduction in recidivism) No “iatrogenic” or “peer contagion” effect of group treatment Source: Adapted from Lipsey et al 2001
Specific Evidenced Based Interventions that Typically do Better than Practice in Reducing Recidivism (29% vs. 40%) • Aggression Replacement Training (ART) • Reasoning & Rehabilitation (RR) • Moral Reconation Therapy (MRT) • Thinking for a Change (TC) • Interpersonal Social Problem Solving (ISPS) • Multisystemic Therapy (MST) • Functional Family Therapy (FFT) • Multidimensional Family Therapy (MDFT) • Adolescent Community Reinforcement Approach (ARCA) • Motivational Enhancement Therapy/ Cognitive Behavior Therapy (MET/CBT) combinations and Other manualized CBT NOTE: There is generally little or no differences in mean effect size between these brand names Source: Adapted from Lipsey et al 2001, Waldron et al, 2001, Dennis et al, 2004
Implementation is Essential (Reduction in Recidivism from .50 Control Group Rate) The best is to have a strong program implemented well The effect of a well implemented weak program is as big as a strong program implemented poorly Thus one should optimally pick the strongest intervention that one can implement well Source: Adapted from Lipsey, 1997, 2001
Data from 14 CSAT Young Offender Re-Entry Program (YORP) grants (N=1066) • 85% Male • 84% Minority (45% Hispanic, 20% African American, 15% Mixed) • 92% Age 15 or older (27% 18 or older) • 70% Below the poverty line (54% below half the poverty line) • 64% From Single Parent Households • 42% With a history of being homeless or running away • 73% With 3 or more years of use (40% with 5 or more) • 90% Self reporting criteria for substance disorders (40% past year dependence; 38% with prior SA treatment) • 58% Self reporting criteria for co-occurring mental health disorders (32% with prior MH treatment)
Co-occurring Psychiatric Conditions 0% 10% 20% 30% 40% 50% 60% 70% 80% 90% 100% 41% Any Past Year Internal Disorder 37% 34% Major Depression Disorder 31% 9% Generalized Anxiety Disorder 9% 21% Suicidal Thoughts or Actions 17% 22% Traumatic Distress Disorder\2 19% 58% Any Past Year External Disorder 49% 49% Conduct Disorder 41% 41% Attention Deficit-Hyperactivity Disorder 31% 1 DC Total 2 YORP Total Compared to 246 adolescent entering juvenile drug courts in 6 CSAT sites \2 Post traumatic distress, acute traumatic distress or disorders of extreme stress not otherwise specified
Pattern of Maltreatment/Victimization 0% 10% 20% 30% 40% 50% 60% 70% 80% 90% 100% Any history of victim. 62% or current worries 75% Lifetime History of 60% Victimization 74% High Levels of 43% Victimization\3 57% 36% Past Year 37% 19% Past 90 Days 12% Current worry about 20% victimization 20% 1 DC Total 2 YORP Total \3 Reporting 4 or more of the following: types of victimization, traumagenic factors (e.g., multiple people, someone they trusted, fearing for life, sexual penetration, people didn't believe them) or continuing fear it will reoccur
\4 Physical assault of another person within the past year. \5 Self report of or arrests related to vandalism, forgery, bad checks, shop lifting, theft, robbery, auto theft. \6 Self report of or arrests related to assault, aggravated assault with a weapon, rape, murder, and arson \7 Self report of or arrests related to driving under the influence, manufacture or distribution, prostitution, gang involvement Pattern of Crime & Violence (towards others) 0% 10% 20% 30% 40% 50% 60% 70% 80% 90% 100% Any Violence or Illegal 82% Activity 85% Acts of Physical 74% Violence\4 81% 67% Any Illegal Activity 65% 48% Property crimes\5 53% 51% Interpersonal crimes\6 53% 52% Drug related crimes\7 50% 1 DC Total 2 YORP Total
No. of Problems* by Severity of Victimization 100% Those with high lifetime levels of victimization have 117 times higher odds of having 5+ major problems* 90% 80% 70% 60% 50% Five or More Four 40% Three 30% Two 20% One None 10% * (Alcohol, cannabis, or other drug disorder, depression, anxiety, trauma, suicide, ADHD, CD, victimization, violence/ illegal activity) 0% Low (31%) Moderate (17%) High (51%) GAIN General Victimization Scale Score (Row %) Source: CSAT AT Common GAIN Data set (odds for High over odds for Low)
Treatment Outcomes by Level of Care: Days of AOD Abstinence* * Percentages in parentheses are the treatment outcome (intake to 12 month change) and the stability of the outcomes (3months to 12 month change) Source: CSAT AT Outcome Data Set (n-9,276)
Treatment Outcomes by Level of Care: Recovery* * Recovery defined as no past month use, abuse, or dependence symptoms while living in the community. Percentages in parentheses are the treatment outcome (intake to 12 month change) and the stability of the outcomes (3months to 12 month change) Source: CSAT AT Outcome Data Set (n-9,276)
Questions • Given the dearth of research on evidenced based practices in juvenile institutions, which related practices are likely to be the most useful to try/study? • What are the key implementation issues that are likely to be essential in this setting? (e.g.., workforce, resources, length of detention) • Given the heterogeneity of clinical and behavioral problems, how do we identify and address the right issues for each adolescent? • Given the high rate of victimization and it association with co-occurring psychiatric, crime and violence problems – what can we do to provide interventions (e.g.., Anger Management, CBITS) to improve the adolescents sense of safety, teach coping skills and/or prepare them for re-entry? • How can we change policies and/ or train the workforce to better facilitate the above? • What strategies can help to provide continuity of care? (e.g., information sharing, joint staffing, transfer processes)
Appendix: Detailed Data on Needs • 2004-2006 Data from 20 CSAT JJ grantees • 246 entering juvenile drug courts in 6 sites: Laredo, TX, San Antonio, TX, Belmont, CA, Tarzana, CA, Pontiac, MI, Birmingham, AL • 1066 existing detention in 14 sites: San Jose, CA, Boston, MA, San Antonio, TX, Long Beach, CA, Racine, WI, San Diego, CA, Huntington, WV, Tucson, AZ, El Paso, TX, Pinellas Park, FL, Fort Collins, CO, Washington, DC, Cleveland, OH, Smyrna, GA • Relative to those entering community substance abuse treatment, they are • Slightly lower on substance use severity • Similar on mental health severity • Slightly higher on crime, violence, and environmental problems
Demographics 0% 10% 20% 30% 40% 50% 60% 70% 80% 90% 100% 22% Female 15% 83% Minority status 84% 1% American Indian/Alaska Native 1% 0% Asian 3% 8% African American\Black 20% 17% Caucasian\White 16% 57% Hispanic 45% 17% Mixed 15% 0% Other 1% 19% Less than 15 years 8% 80% 15-17 years 65% 18+ years 27% 1% 1 DC Total 2 YORP Total
Living Situation 0% 10% 20% 30% 40% 50% 60% 70% 80% 90% 100% 24% Very poor (0-49%) 54% 20% Poor (50-99%) 16% 29% Working class (100-299%) 23% 22% Upper middle class (300-999%) 6% 4% Upper class (1000%+) 2% 52% Single parent family 64% 26% Weekly Alcohol Use in Home 11% 10% Weekly Drug Use in Home 9% 31% Ever Homeless/Runaway 42% 1 DC Total 2 YORP Total
\1 Spent time in the past year with 1 or more people at work/school who got drunk weekly \2 Spent time in the past year with 1 or more people socially who got drunk weekly \3 Spent time in the past year with 1 or more people at work/school (or socially) who used drugs quarterly Peer Alcohol and Drug Use 0% 10% 20% 30% 40% 50% 60% 70% 80% 90% 100% Regular Peer Alcohol Use 39% at Work/School\1 Regular Peer Alcohol Use\2 48% Regular Peer Drug Use at Work/School\3 44% Regular Peer Drug Use\3 52% 1 DC Total 2 YORP Total
\4 During the past 90 days \5 Attacked with a weapon, beaten to the point of bruises or broken bones, sexually assaulted, or emotionally abused. '\6 Count of types of victimization and the number of traumagenic factors (GVS) is 4 or more. Environment 0% 20% 40% 60% 80% 100% 88% In school \4 85% 26% Employed\4 13% 99% Any CJ Involvement 100% 96% Current CJ Involvement\4 94% 51% Controlled Environment\4 92% 60% Ever Been Victimized\5 74% 43% High Levels of Victimization\6 57% 19% Victimization (P90)\4 12% 1 DC Total 2 YORP Total
History of Substance Use 0% 10% 20% 30% 40% 50% 60% 70% 80% 90% 100% 7% Under 10 11% Age of First 82% Age 10-14 76% Use 11% Age 15-17 12% 0% Age 18 or older 1% 4% Less than 1 2% Years 42% 1-2 years 25% of Use 36% 3-4 years 33% 18% 5 or more years 40% 1 DC Total 2 YORP Total
Past 90 Day Substance Use 0% 10% 20% 30% 40% 50% 60% 70% 80% 90% 100% 65% Weekly use of anything 28% 15% Weekly Alcohol Use\2 7% 46% Weekly Tobacco Use\2 27% 50% Weekly Marijuana Use\2 18% 3% Weekly Crack/Cocaine Use\2 2% 2% Weekly Heroin/Opiod Use\2 1% 9% Weekly Other Drug Use\2 2% 2% Any past 90 day needle use 0% 32% 13+ Days in Controlled Environment\2 84% 1 DC Total 2 YORP Total \2 During the past 90 days
Substance Problem 0% 10% 20% 30% 40% 50% 60% 70% 80% 90% 100% Perceives AOD as a 26% 22% problem\3 Perceives need for ANY 71% 79% treatment Ready to remain 33% 60% abstinent (100%) Ready to quit (80% or 50% 35% more) Lifetime 91% 90% Abuse/Dependence Past Year 88% 70% Abuse/Dependence Past Month 32% 16% Abuse/Dependence 1 DC Total 2 YORP Total \3 Do you currently feel that you have any problems related to alcohol or drug use?
Presenting Severity 0% 10% 20% 30% 40% 50% 60% 70% 80% 90% 100% 1% No Use 1% (Past Year) Presenting Severity 12% Use 29% 39% Abuse 27% 4% Dependence 7% 45% Physiological Dependence 36% 46% Any lifetime 32% Withdrawal 31% Any past week 13% 4% Acute past week 2% 1 DC Total 2 YORP Total
Prior Treatment Episodes 0% 10% 20% 30% 40% 50% 60% 70% 80% 90% 100% 68% None 62% 32% Any 38% 17% One 24% 15% Two or more 14% 1 DC Total 2 YORP Total
Co-occurring Psychiatric Conditions 0% 10% 20% 30% 40% 50% 60% 70% 80% 90% 100% 41% Any Past Year Internal Disorder 37% 34% Major Depression Disorder 31% 9% Generalized Anxiety Disorder 9% 21% Suicidal Thoughts or Actions 17% 22% Traumatic Distress Disorder\2 19% 58% Any Past Year External Disorder 49% 49% Conduct Disorder 41% 41% Attention Deficit-Hyperactivity Disorder 31% 1 DC Total 2 YORP Total \2 Post traumatic distress, acute traumatic distress or disorders of extreme stress not otherwise specified
Pattern and Tx of Psychiatric Conditions 0% 10% 20% 30% 40% 50% 60% 70% 80% 90% 100% 32% Neither 42% 10% Internal only 9% 32% Both 28% 27% External only 21% Any prior MH 33% treatment 32% 1 DC Total 2 YORP Total
Pattern of Maltreatment/Victimization 0% 10% 20% 30% 40% 50% 60% 70% 80% 90% 100% Any history of victim. 62% or current worries 75% Lifetime History of 60% Victimization 74% High Levels of 43% Victimization\3 57% 36% Past Year 37% 19% Past 90 Days 12% Current worry about 20% victimization 20% 1 DC Total 2 YORP Total \3 Reporting 4 or more of the following: types of victimization, traumagenic factors (e.g., multiple people, someone they trusted, fearing for life, sexual penetration, people didn't believe them) or continuing fear it will reoccur
Other HIV Risks 0% 10% 20% 30% 40% 50% 60% 70% 80% 2% Any past 90 day needle use 0% 68% Any past 90 day sexual experience 44% 33% Any past 90 day unprotected sex 17% Multiple sexual 34% partners in past 90 21% days 1 DC Total 2 YORP Total
\4 Physical assault of another person within the past year. \5 Self report of or arrests related to vandalism, forgery, bad checks, shop lifting, theft, robbery, auto theft. \6 Self report of or arrests related to assault, aggravated assault with a weapon, rape, murder, and arson \7 Self report of or arrests related to driving under the influence, manufacture or distribution, prostitution, gang involvement Pattern of Crime & Violence (towards others) 0% 10% 20% 30% 40% 50% 60% 70% 80% 90% 100% Any Violence or Illegal 82% Activity 85% Acts of Physical 74% Violence\4 81% 67% Any Illegal Activity 65% 48% Property crimes\5 53% 51% Interpersonal crimes\6 53% 52% Drug related crimes\7 50% 1 DC Total 2 YORP Total
Errata • References Cited: Dennis, M. L., Godley, S. H., Diamond, G., Tims, F. M., Babor, T., Donaldson, J., Liddle, H., Titus, J. C., Kaminer, Y., Webb, C., Hamilton, N., & Funk, R. (2004). The Cannabis Youth Treatment (CYT) Study: Main Findings from Two Randomized Trials. Journal of Substance Abuse Treatment, 27, 197-213. Lipsey, M. W. (1997). What can you build with thousands of bricks? Musings on the cumulation of knowledge in program evaluation. New Directions for Evaluation, 76, 7-23. Lipsey, M. W., Chapman, G. L., & Landenberger, N. A. (2001). Cognitive-behavioral programs for offenders. The Annals of the American Academy of Political and Social Science, 578, 144-157. Waldron, H. B., Slesnick, N., Brody, J. L., Turner, C. W., & Peterson, T. R. (2001). Treatment outcomes for adolescent substance abuse at four- and seven-month assessments. Journal of Consulting and Clinical Psychology, 69, 802-813. • Assessment Instruments • GAIN Coordinating Center at www.chestnut.org/li/gain • CSAT TIP 3 at http://www.athealth.com/practitioner/ceduc/health_tip31k.html • NIAAA Assessment Handbook at http://www.niaaa.nih.gov/publications/instable.htm • Treatment Programs • CSAT CYT, ATM, ACC and other treatment manuals at www.chestnut.org/li/apss/csat/protocols and on CDs provided • SAMHSA Knowledge Application Program (KAP) at http://kap.samhsa.gov/products/manuals • NCADI at www.health.org • National Registry of Effective Prevention ProgramsSubstance Abuse and Mental Health Services Administration (SAMHSA), Department of Health and Human Services : http://www.modelprograms.samhsa.gov • Society for Adolescent Substance Abuse Treatment Effectiveness (SASATE) www.chestnut.org/li/apss/sasate • 2006 Joint Meeting on Adolescent Substance Abuse Treatment Effectiveness http://www.mayatech.com/cti/jmate/ April 25-27, 2007, Washington< DC