Download
1 / 1
10 likes | 136 Views
17. 24. 50ug Total protein. 4. 13. Methylated. 5ug Total protein. (A). Intact LHB protein with methylation. Spec 53 (RT= 817.2 sec.). Non-Methylated. 0.5ug Total protein. L31. 8566.315 Da (calculated). 8566.334 Da (measured). Scan #92 (RT= 1152 sec.). Hexapole. L29 - M. S15 - M.

E N D
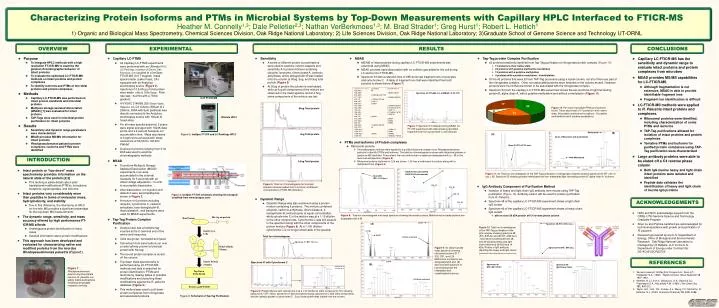
17 24 50ug Total protein 4 13 Methylated 5ug Total protein (A) Intact LHB protein with methylation Spec 53 (RT= 817.2 sec.) Non-Methylated 0.5ug Total protein L31 8566.315 Da (calculated) 8566.334 Da (measured) Scan #92(RT= 1152 sec.) Hexapole L29 - M S15 - M S20 - M L24 - M His-tag on protein Bait Protein 1 Figure 8:Total ion chromatogram andmass spectrum showing ribosomal proteins. Methionine truncated proteins are designated with a M. Gently Lyse Cells Spectrum 48 (RT= 832.2 sec.) L24-M (A) Figure 12: Total ion chromatogram of the TAP-Tag purification of the IgG complex showing spectrum 48 (RT= 832.2s) and 49 (RT= 849 sec.) . Also deconvoluted spectrum 48 and 49 showing heavy and light chain variants at 56 kDa and 14 kDa. Picture of IgG antibody depicting the heavy and light chains (www.biotech.ubc.ca/Biomedicine/mucosalimmunity). Total Ion chromatogram 2 S17-M Spectrum 47 (RT= 723 sec.) 4 S20-M 3 Nickel Affinity Column L24-M & methylated 1 5 Spectrum 49 (RT= 849 sec.) S21 Isolate Protein complex Spectrum 47 with Cytochrome C 0.5ug total of cytochrome C Top Down FT-ICR-MS Spectrum 49 IgG Heavy Chain Spectrum 48 IgG Light Chain L24-M (B) Protein and PTM ID L24-M and methylated Characterizing Protein Isoforms and PTMs in Microbial Systems by Top-Down Measurements with Capillary HPLC Interfaced to FTICR-MS Heather M. Connelly1,3; Dale Pelletier2,3; Nathan VerBerkmoes1,3; M. Brad Strader1; Greg Hurst1; Robert L. Hettich11) Organic and Biological Mass Spectrometry, Chemical Sciences Division, Oak Ridge National Laboratory; 2) Life Sciences Division, Oak Ridge National Laboratory; 3)Graduate School of Genome Science and Technology UT-ORNL OVERVIEW EXPERIMENTAL RESULTS CONCLUSIONS • Capillary LC-FTMS • All Capillary LC-FTMS experimentswere performed with an Ultimate HPLC (LC Packings, a division of Dionex, San Francisco, CA) coupled to a IonSpec FTICR-MS (9.4 T magnet) mass spectrometer (Lake Forest, CA) equipped with an Analytica electrospray source (Figure 2). Injections of 0.5-50ug of total protein were made onto a 100ul loop. Flow rate was ~4ul/min with a 75min gradient. • A VYDAC 214MS5.325 (Grace-Vydac, Hesperia, CA) C4 column (300μm id x 250mm, 300Å with 5μm particles) was directly connected to the Analytica electrospray source with 100μm id fused silica • For all mass spectra acquired, 2 scans were signal averaged with 1024K data points and a 2 second hexapole ion accumulation time. Mass accuracies to 5 ppm were achieved with mass resolutions of 50,000 to 100,000 FWHM. • A series of proteins ranging from 5-30 kDA was used to examine chromatography methods • MSAD • To perform Multipole StorageAssisted Dissociation (MSAD) experiments, ions were accumulated in the external hexapole for 5 seconds with an offset voltage adjusted to -13 volts to accomplish dissociation. • After dissociation, ion injection and detection were accomplished as shown in Figure 3. • A mixture of 6 proteins including ubiquitin, cytochrome C, carbonic anhydrase, beta-lactoglobulin-B, ribonuclease A, and lysozyme were used for MSAD experiments. • Tap-Tag Protein Complex Purification • A bait protein has a histidine tag inserted at the C-terminal end of the amino acid sequence. • Cells are grown, harvested and lysed. • Cell extract from lysed cells is run over a nickel affinity column to bind bait protein with his-tag. • The bound protein complex is eluted off the column. • Top-down mass spectrometry is performed using LC-FTICR-MS methods and data is searched for protein identification, PTMs and Isoforms by making tables of possible modifications and searching these modifications against the R. palustris database (Figure 4). • This method was used to pull down protein complexes from nitrogenase and associated proteins. • Sensitivity • A series of different protein concentrations were used to examine column capacity and sensitivity. A 5 protein mixture containing ubiquitin, lysozyme, ribonuclease A, carbonic anhydrase, and b-lactoglobulin-B was loaded onto the column at 50ug, 5ug, and 0.5ug total protein (Figure 5) • At 50ug of protein the column is overloaded, while at 5ug all components of the mixture are observed in the mass spectra, and at 0.5ug some components of the mixture are lost • MSAD • MS/MS of intact proteins during capillary LC-FTICR-MS experiments was examined using MSAD. • MSAD provides rapid dissociation with no collision gas added to the cell during LC elution into FTICR-MS • Spectrum 33 with a retention time of 695.4s shows fragment ions of lysozyme and cytochrome C. A table of fragment ions that were identified from both proteins is shown below (Figure 7) • Tap-Tag protein Complex Purification • 42 proteins tentatively identified from Tap-Tag purification of nitrogenase protein complex (Figure 10) • 17 proteins in their native state • 24 proteins with putative methionine truncations • 13 proteins with a putative methylation • 4 proteins with a putative acetylation / trimethylation • Of the 42 proteins that were ID from TAP-Tag procedure using a nickel column, not all of them are part of the nitrogenase complex. Other non associated proteins were retained on the column as well. However, proteins were found that are known to be associated with the nitrogenase complex. • Spectrum 53 from the capillary LC-FTICR-MS experiment shows the two isoforms of light harvesting protein B, alpha chain A, with a putative methylation and without a methylation (Figure 11) • Capillary LC-FTICR-MS has the sensitivity and dynamic range to evaluate intact proteins and protein complexes from microbes • MSAD provides MS/MS capabilities for LC-FTICR-MS • Although fragmentation is not extensive, MSAD is able to provide identifiable fragment ions • Fragment ion identification is difficult • LC-FTICR-MS methods were applied to R. Palustris intact proteins and complexes. • Ribosomal proteins were identified, including characterization of some PTMs and isoforms • TAP-Tag purifications allowed for isolation of intact proteins and protein complexes • Tentative PTMs and Isoforms for purified protein complexes using TAP-Tag purification were characterized • Large antibody proteins were able to be eluted off a C4 reverse phase column • Both IgG murine heavy and light chain intact proteins were isolated and identified • Peptide data validates the identification of heavy and light chain of murine IgG proteins • Purpose • To integrate HPLC methods with a high resolution FT-ICR-MS to examine the general chromatographic behavior of intact proteins • To evaluate the optimized LC-FTICR-MS methods on intact proteins and protein complexes • To identify isoforms and PTMs of microbial proteins and protein complexes • Methods • Capillary LC-FTICR-MS was performed on intact protein standards and microbial proteins • Multipole storage assisted dissociation (MSAD) [1] was evaluated for intact proteins • TAP-Tags were used in microbial protein purification for intact proteins • Results • Sensitivity and dynamic range parameters were characterized • MSAD provides MS/MS information for intact proteins • Rhodopseudomonas palustris protein complexes, isoforms and PTMs were identified Spectrum 33 (RT=695.4 s) of MSAD LC-FT-ICR 9.4T FTICR-MS Figure 10: Pie chart of possible PTMs and isoforms found. There was a total of 17 proteins in their native state, 24 putative methionine truncations, 13 putative methylations and 4 putative acetylations. Ultimate HPLC Figure 7: Spectrum 33 obtained during MSAD LC-FT-ICR experiment with table showing identified fragment ions from cytochrome C and ubiquitin (B) Figure 2: IonSpec FT-ICR and LC-Packings HPLC • PTMs and Isoforms of Protein complexes • Ribosomal proteins • Chromatography methods were applied to a purified ribosome complex from Rhodopseudomonas palustris to identify PTM’s and isoforms. The total ion chromatogram is shown with ribosomal proteins in spectrum #92 identified. The proteins that are methionine truncated are designated with a (- M) in the deconvoluted spectrum (Figure 8). • Ribosomal proteins isoforms for L24 are shown. L24 has a methionine truncation along with a methylated form (Figure 9). INTRODUCTION • Intact protein or “top-down” mass spectrometry provides information on the natural state of the protein [2,3] • This technique yields details about post-translational modifications (PTM’s), truncations, mutations, signal peptides, and isoforms • Intact proteins vary considerably more than peptides in terms of molecular mass, hydrophobicity, and stability • Due to this difference, the interfacing of HPLC on-line with MS provides a significant advantage for the top-down MS measurements • The dynamic range, sensitivity, and mass accuracy offered by high performance FT-ICR-MS affords • Unambiguous protein identification in many cases • Detailed information about protein modifications • This approach has been developed and evaluated for characterizing native and modified proteins from the microbe Rhodopseudomonas palustris (Figure1). Figure 11: (A) Total Ion Chromatogram of the TAP-Tag purification of nitrogenase complex showing spectrum 53 (RT= 817.2 sec.). (B) Spectrum 53 showing putative methylated and non-methylated light harvesting protein B, alpha chain A isoforms. Figure 5. Total Ion Chromatograms for 5 protein standard mixture loaded onto C4 column at different concentrations (FTICR-MS detection). • IgG Antibody Component of Purification Method • Isolation of heavy and light chain IgG antibody from mouse using TAP-Tag purification (Figure 12). Antibody elution will be used for protein purification from R. Palustris. • Spectrum 48 of the capillary LC-FTICR-MS experiment shows a light chain IgG variant • Spectrum 49 of the capillary LC-FTICR-MS experiment shows a heavy chain IgG variant • able to elute 56 kDA protein off C4 reverse phase column Figure 3: IonSpec FT-ICR schematic showing the hexapole (modified from www.ionspec.com) • Dynamic Range • Dynamic Range was also examined using a protein mixture containing 6 proteins. The mixture contained ubiquitin, carbonic anhydrase, ribonuclease A, b-lactoglobulin-B, and lysozyme at equal concentration, while cytochrome C in the mixture was at a 1:10 dilution to the other components. Cytochrome C was still present in the spectrum along with the other components of the protein mixture (Figure 6). At a 1:100 dilution cytochrome C is no longer observable in the spectra. ACKNOWLEDGEMENTS • HMC and NCV acknowledge support from the ORNL-UTK Genome Science and Technology Graduate Program • Shen Lu and Patricia Lankford are acknowledged for technical assistance with growth and purification of R. palustris • Research sponsored by the U.S. Department of Energy, Office of Biological and Environmental Research. Oak Ridge National Laboratory is managed by UT-Battelle, LLC for the U.S. Department of Energy under Contract No. DE-AC05-00OR22725 Figure 9: (A) deconvoluted mass spectrum showing ribosomal proteins S17, S20, S21, and L24. Methionine truncations are designated with a M. (B) deconvoluted spectrum of L24 showing both the methylated and unmethylated isoforms REFERENCES Figure 1:Rhodopseudomonas palustris liquid and plate cultures. R. palustris is a widely distributed bacteria exhibiting remarkable metabolic diversity. • Sannes-Lowery,K.;Griffey,R.H; Kruppa,G.H.; Speir,J.P.; Hofstadler, S.A. (1998) Rapid Commun. Mass Spectrom12, 1957-1961. • Kelleher, N.L; Lin H.Y.; Valaskovic, G.A.; Aaserud D.j.; Fredriksson E.K.; McLafferty F.W. (1999) J Am Chem Soc121, 806-212. • Taylor, G.K.; Kim, Y.B.; Forbes, A.J.; Meng, F.Y.; McCarthy, R.; Kelleher, N.L. (2003) Analytical Chemistry75, 4081-4086. Figure 6: Protein Mixture with cytochrome C at a 1:10 dilution to other components. TIC showing spectrum 47 (RT=723s), spectrum 47 deconvoluted showing cytochrome C with other components, and the isotopic packet of cytochrome C. 5ug of total protein was loaded onto the column. Figure 4: Schematic of Tap-Tag Purification