Download

1 / 29
330 likes | 360 Views
Chapter 9: Balancing Demand and Productive Capacity. Variations in Demand Relative to Capacity (Fig 9.1). VOLUME DEMANDED. Demand exceeds capacity. (business is lost). CAPACITY UTILIZED. Demand exceeds. Maximum Available. optimum capacity. Capacity. (quality declines ).

E N D
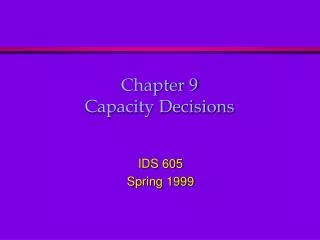
Chapter 9: Balancing Demand and Productive Capacity
Variations in Demand Relative to Capacity (Fig 9.1) VOLUME DEMANDED Demand exceeds capacity (business is lost) CAPACITY UTILIZED Demand exceeds Maximum Available optimum capacity Capacity (quality declines) Optimum Capacity (Demand and Supply Well Balanced) Excess capacity (wasted resources) Low Utilization (May Send Bad Signals) TIME CYCLE 2 TIME CYCLE 1
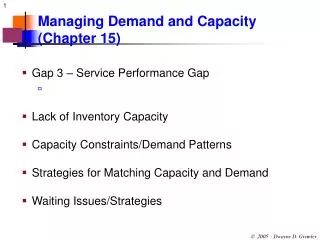
From Excess Demand to Excess Capacity Four conditions potentially faced by fixed-capacity services: • Excess demand • Too much demand relative to capacity at a given time • Maximum capacity • Upper limit to a firm’s ability to meet demand at a given time • Optimum capacity • Point beyond which service quality declines as more customers are serviced • Excess capacity • Too much capacity relative to demand at a given time
Approaches to the Problem of Fluctuating Demand • Two options: • Manage supply (capacity management) • time, labor, equipment, facility constraints • watch carefully: employee satisfaction • Manage demand • market needs constraints • watch carefully: customer satisfaction Many firms use a mix of both approaches
Constraints on Capacity • Time • legal, consulting, accounting, medical • Labor • legal, consulting, accounting, medical • Equipment • delivery services, telecommunication, health club • Facilities • hotels, restaurants, hospitals, airlines, schools, theaters, churches Any of the service firms listed can be operating under multiple constraints.
Alternative Capacity Management Strategies • Level capacity (fixed level at all times) • Stretch and shrink (Should be used for short period) • Offer inferior extra capacity at peaks (e.g., bus/train standees) • Vary seated space per customer (e.g., elbow room, leg room) • Extend/cut hours of service • Chase demand (adjust capacity to match demand) • Use part-time employees • Rent or share extra facilities and equipment • Ask customers to share • Outsourcing
Alternative Capacity Management Strategies • Invite customers to perform self-service • Cross-train employees • Schedule downtime during periods of low demand • Modify or move facilities and • Flexible capacity (Vary mix by segment) • Not all unsold capacity is wasted • Free trials for prospective customers • Free trials for intermediaries • Employee rewards • Bartering with firms own suppliers
Patterns and Determinants of Demand • To manage fluctuating demand it is necessary to have a clear understanding of- • Demand patterns • Cyclical Vs Random • Underlying causes of variations • Specific market segment responsible for the variation • Keep good records of transactions to analyze demand patterns • Sophisticated software can help to track customer consumption patterns
Identifying Variations in Demand by Time Period Season of Year Off-peak Shoulder Peak Time of Day Morning peak Midday Afternoon peak Day of Week Evening/ Weekday night Weekend
Predictable Demand Patterns and Their Underlying Causes (Table 9.1) • day • week • month • year • other • billing or tax payments/refunds • pay days • school hours/holidays • seasonal climate changes • public/religious holidays • natural cycles • employment (e.g., coastal tides) Predictable Cycles of Demand Levels Underlying Causes of Cyclical Variations
Analyzing Demand by Market Segment • Different customers have different demand patterns by day or by season (e.g., business travelers vs. tourists) • Some users have little choice in timing of demand, others are flexible (e.g. commuters vs. shoppers) • Some demand is undesirable and should be discouraged (e.g., inappropriate calls to emergency services)
Alternative Demand Management Strategies (Table 9.2) • Take no action • Let customers sort it out • Reduce demand • Higher prices • Communication promoting alternative times • Increase demand • Lower prices • Communication, including promotional incentives • Vary product features to increase desirability • More convenient delivery times and places • Inventory demand by reservation system • Inventory demand by formalized queuing
Marketing Strategies CanReshape Some Demand Patterns • Use price and other costs to manage demand • Change product elements • Modify place and time of delivery • No change • Vary times when service is available • Offer service to customers at a new location • Promotion and education
Yield Management • The process of allocating the right type of capacity to the right kind of customer at the right price so as to maximize yield or revenue. • Ratio of actual revenue to potential revenue for a particular measurement period. • Yield = Actual Revenue • Actual Revenue = Actual capacity used x Average actual price • Potential Revenue = Total capacity x Maximum price Potential Revenue
Ideal Characteristics for Yield Management • Relatively Fixed Capacity • Ability to Segment Markets • Perishable Inventory • Product Sold in Advance • Fluctuating Demand • Low Marginal Sales Cost and High Capacity Change Cost
Seasonal Allocation of Rooms by Service Class for Resort Hotel First class Standard Budget 20% 20% 20% 30% 50% 30% 50% 60% Percentage of capacity allocated to different service classes 50% 30% 30% 10% Peak Shoulder Off-peak Shoulder (30%) (20%) (40%) (10%) Summer Fall Winter Spring Percentage of capacity allocated to different seasons
Waiting Is a Universal Phenomenon! • An average person may spend up to 30 minutes/day waiting in line—equivalent to over a week per year! • Almost nobody likes to wait • It's boring, time-wasting, and sometimes physically uncomfortable
Why Do Waiting Lines Occur? • Because the number of arrivals at a facility exceeds capacity of system to process them at a specific point in the process • Queues are basically a symptom of unresolved capacity management problems
Saving Customers from Burdensome Waits • Add extra capacity so that demand can be met at most times (problem: may increase costs too much) • Rethink design of queuing system to give priority to certain customers or transactions • Redesign processes to shorten transaction time • Manage customer behavior and perceptions of wait • Install a reservations system
21 29 28 20 25 30 24 26 31 27 23 32 Alternative Queuing Configurations (Fig 9.5) Single line, single server, single stage Single line, single servers, sequential stages Parallel lines to multiple servers Designated lines to designated servers Single line to multiple servers (“snake”) “Take a number” (single or multiple servers)
Criteria for Allocating Different Mkt Segments to Designated Lines • Urgency of job • Emergencies versus non-emergencies • Duration of service transaction • Number of items to transact • Complexity of task • Payment of premium price • First class versus economy • Importance of customer • Frequent users/high volume purchasers versus others
Ten Propositions on Psychology of Waiting Lines (1) (Table 9.3) • Unoccupied time feels longer than occupied time • Pre- and post-process waits feel longer than in-process waits • Anxiety makes waits seem longer • Uncertain waits are longer than known, finite waits • Unexplained waits are longer than explained waits
Ten Propositions on Psychology of Waiting Lines (2) (Table 9.3) • Unfair waits are longer than equitable waiting • People will wait longer for more valuable services • Waiting alone feels longer than waiting in groups • Physically uncomfortable waits feel longer • Waits seem longer to new or occasional users