Download
1 / 23
230 likes | 345 Views
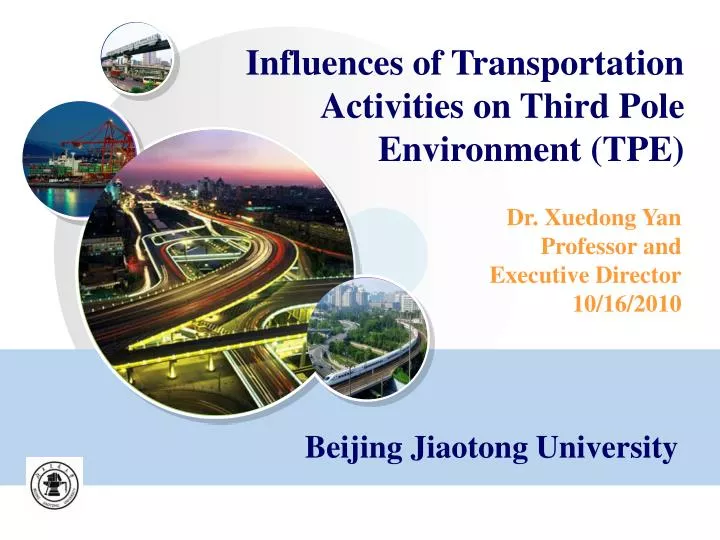
Influences of Transportation Activities on Third Pole Environment (TPE). Dr. Xuedong Yan Professor and Executive Director 10/16/2010. Beijing Jiaotong University. Motivation. Global warming trend Retreatment of glaciers The anthropogenic influences Transportation Role :

E N D
Influences of Transportation Activities on Third Pole Environment (TPE) Dr. Xuedong YanProfessor and Executive Director10/16/2010 Beijing Jiaotong University
Motivation • Global warming trend • Retreatment of glaciers • The anthropogenic influences • Transportation Role : • Energy consumption • Green House Gas (GHG) • Black Carbon (BC) • Urban air pollution • To protect TPE in the field of transportation
Outline Transportation Influences on TPE At Global Level At Regional Level At Local Level Response in the Field of Transportation
Global Level Influence • GHGs warm the earth surface and atmosphere, resulting in rainfall, retreat of glaciers and sea ice, sea level, and other environment issues. • Black carbon (BC) in soot particles is potentially the second major contributor to the observed global warming. • The transportation sector has the second largest and increasing contributions to both GHG emission and BC formation.
Global Level Influence Energy use distribution per sector • Energy use in the transportation sector includes the energy consumed in moving people and goods by road, rail, air, water, and pipeline. • Growth rates for economic activity and population are the key factors for transportation energy demand. • It keeps increasing by 1.3 percent per year from 2007 to 2035.
Global Level Influence • Carbon dioxide emissions per sector • Carbon dioxide emissions per transport sector
Global Level Influence BC distribution per sector • On a global basis, transportation, residential, and industrial sectors have notable contributions to black carbon (25%, 20% and 10%, respectively). • Open burning provides most of the rest (45%).
Global Level Influence BC distribution by region and sector • Road transportation is the dominant contributor to BC in North America, Latin America, and Europe, relying on diesel vehicles. • China and India have a small portion from transportation.
Regional Level Influence • There is a variability in the warming trend. • The Tibet plateau faces a temperature rise of up to 0.3 C0 per decade: approximately three times of the global warming rate. • Warming trends are greater in western China than those in eastern China. • The Indian monsoon blows over the Indian Ocean, which carry pollutants emitted in those countries of the South Asia to the third pole region. • The air mass from Southeastern China may carry transportation pollutants generated in those high emission areas to the third pole region.
Regional Level Influence • Energy consumption for transportation by country grouping, 2007-2035 (Quadrillion Btu)
Regional Level Influence • Energy consumption and BC emission by sector and fuel type in China • The increased use of diesel vehicles in the future will result in a larger share of the transport sector in total BC emission.
Regional Level Influence • Carbon dioxide emission in China • In comparison with most other countries, the share of CO2 emissions from the transport sector in China is comparatively low, with 8% in 2000. It is projected to increase to 12% by 2020. CO2 1995 2005
Local Level Influence • Though the plateau region is relatively underdeveloped, it undergoes rapid economic growth and booming tourism in recent years, which brings increase in energy demand, transportation development, and pollution. • The pressure on the unique ecosystem of Tibet Plateau is predictably increasing.
Local Level Influence • Land cover is changing along the Qinghai-Tibet Highway and Railway. • The Qinghai-Tibet Highway and Railway are from Xining to Lhasa with total lengths of 2000 km respectively. • Land covers of the agriculture and alpine meadow along the transportation corridors are increasing and those of the alpine grassland and desert grassland are decreasing.
Local Level Influence • The construction of Qinghai–Tibet railway has promoted local tourism and economy. • The numbers of tourists in both Qinghai and Tibet showed sharp increases in recent years. • Till 2010 September, the number of vehicles in Tibet is 216,478. That in Lhasa is more than 120,000. • Increasing rate is as high as 30%. • Road traffic exhaust emissions and air quality in urban areas should be paid more attention.
Local Level Influence • In Kullu valley of North Western Himalayas in India, the area has experienced tremendous growth in tourism. • The total tourist traffic to the region increased from 6.55 million in 2004 to 9.75 million in 2008. • Observations to the ultrafine particles in the area shows a bimodal structure with morning and evening peaks.
Transportation Strategies in Response to TPE Degradation • Management -- Control of the vehicle exhaust: • New vehicles should comply with at least Euro3 vehicles exhaust emission standards. • In-use vehicle inspection and maintenance system must be strengthened to eliminate gross polluters. • High-emission vehicles should be identified and repaired or scrapped; and fuel quality should be improved.
Transportation Strategies in Response to TPE Degradation • Management – Traffic Demand Control • Limiting the growth in travel demand: increases in fuel prices will tend to dampen the growth in VMT (Vehicle Mileage Travel) • Expanding transit service and other alternatives to single-occupant vehicle travel; • Encouraging E-bike use and reducing car ownership • Encouraging land uses that minimize the number and length of auto trips.
Transportation Strategies in Response to TPE Degradation • Operation -- Mitigating Urban Traffic Congestion: • We are experiencing increasing congestion on our highways, railways, airports and seaports. • Driving in urban areas, 17.2% of fuel is lost due to idling stop lights or traffic congestion. • Countermeasures: • Public transportation • Enhance road network capacity • Intelligent transportation system
Transportation Strategies in Response to TPE Degradation • Technological Innovations in Vehicles and Fuels • Emerging technologies hold the key to even greater reductions in transportation emission. • Technology Deployment: • Gas/Electric Hybrids • Electric cars • Hydrogen Fuel-Cell Vehicles • Biofuels • Developed countries should share environment technologies with developing countries. Otherwise, their efforts will have little effect if the emissions continue to rise dramatically in China, India, and other developing countries.
Emerging Research Topics Related to Transportation • Status and future of transportation energy consumption and its impacts on TPE • Establish Vehicle Emission Inventory for Tibet • VMT, Number of Vehicles, and Emission Prediction for Tibet • High resolution urban air quality modeling at Lhasa • Characteristics of Vehicle Emission Factors in High Latitude Region • Assessment of heavy metal contamination of roadside soils in Tibet • ……