Download
1 / 31
310 likes | 464 Views
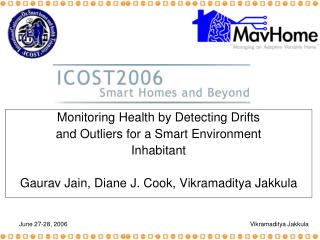
Monitoring Health by Detecting Drifts and Outliers for a Smart Environment Inhabitant Gaurav Jain, Diane J. Cook, Vikramaditya Jakkula. UTA Project Unique Focus on entire home House perceives and acts Sensors Controllers for devices Connections to the mobile user and Internet

E N D
Monitoring Health by Detecting Drifts and Outliers for a Smart Environment Inhabitant Gaurav Jain, Diane J. Cook, Vikramaditya Jakkula Vikramaditya Jakkula
UTA Project Unique Focus on entire home House perceives and acts Sensors Controllers for devices Connections to the mobile user and Internet Unified project incorporating varied AI techniques, cross disciplinary with mobile computing, databases, multimedia, and others MavHome Vikramaditya Jakkula
Goals The goals of an intelligent environment control system should be to 1. Maximize the safety and security of the inhabitant(s) 2. Maximize the comfort of the inhabitant(s) by automating their environment the fullest and most desirable extent possible 3. Minimize the consumption of natural resources in an effort to reduce costs and maximize environment efficiency. MavHome Vikramaditya Jakkula
Environment • MavHome Environment • MavDen • MavKitchen • MavPad Vikramaditya Jakkula
Environment-Contd Vikramaditya Jakkula
Overview Vikramaditya Jakkula
Minimal Sequential Patterns Using “ED” Given an input stream S of event occurrences O, ED: 1. Partitions S into Maximal Episodes, Pmax. 2. Creates Itemsets, I, from the Maximal Episodes. 3. Creates a Candidate Significant Episode, C, for each Itemset I, and computes one or more Significance Values, V, for each Candidate. 4. Identifies Significant Episodes by evaluating the Significance Values of the candidates. Core Technologies Vikramaditya Jakkula
Decision Making using ProPHeT ProPHeT is the main controlling component of the system It uses data filtered through Episode Discovery (ED) to create a Hierarchical Hidden Markov Model (HHMM). HHMM represents a user model that includes all of the episodes (e.g., entering a room, watching TV, sitting in a chair and listening to music, and so forth) that a person performs in the environment. Core Technologies Vikramaditya Jakkula
Core Technologies Vikramaditya Jakkula
Need for Health Monitoring • Problem • Elderly, disabilities and the chronic ill need health care. • Personal preference • Increased care cost • Inadequate infrastructure • Solution • Low-cost automated health monitoring system at home • Lanspery & Hyde state “For most of us, the word ‘home’ evokes powerful emotions [and is] a refuge” Vikramaditya Jakkula
n-k Σ ( xi - μ ) (xk - μ ) i=1 rk = (n-k) * σ2 Drift Detection Algorithm • Diurnal algorithm • Uses autocorrelation plots • Three Steps • Update history • Detect drifts • Report Generation • Input: history h, frequency sets, action list and their criticalities • OutFile: report file • update h with the frequency sets • for each action a loop • find the drift type d in action a’s history • send the drift d for action a to the report manager • the report manager generates the final report based on the criticality of each action, the current drift parameters and previous drift parameters. Vikramaditya Jakkula
Maintains six-hourly, daily, weekly history queues. Input is four six-hourly frequency sets. Different window sizes are posible Large window vs. small window Update History Vikramaditya Jakkula
Input: action a, history h, reporter r OutFile: drift type d and its parameters p check if action a has drift type d == no drift if yes then send the drift type and its parameters to the reporter return to the calling function check if action a has drift type d == cyclic or increasing if yes then send the drift type and its parameters to the reporter return to the calling function send the drift type as chaotic to the reporter Detecting Drifts Vikramaditya Jakkula
No-drift? constant for a significant period of time, and may have random noise. Only the top half of the autocorrelation plot is used. Why? Test: autocorrelation plot values < threshold. Why? Less than 10% of these values should lie outside the (m – 2s, m + 2s) range. Why? Test for no-drift Vikramaditya Jakkula
cyclic trend shows high upward peaks in autocorrelation graph Test for Cyclic Vikramaditya Jakkula
High degree of autocorrelation is between adjacent and near-adjacent observations. High value at lag one Value decreases with increase in lag Slopelength is the smallest lag at which the values stops decreasing. Note: Random noise is suppressed by the autocorrelation plot Test for Sloping Vikramaditya Jakkula
No test for chaotic Anything not yet classified ends up any chaotic Causes: large number of irregular changes heavy non-random noise in data in all the windows sudden large changes in the distribution seen for a short period of time when drift type changes Reporting of drifts will be discussed after presentation of the outlier detection algorithms Test for Chaotic Vikramaditya Jakkula
Two types of outliers Extremely high or low value in periodic frequency Occurrence unexpected action in an ordered sequence of actions. Separate algorithms for each Autocorrelation-based outlier detection Uses drift detection method Outlier if last data point lies outside (m – 3s, m + 3s), Tested for all window sizes. If found outlier, then drift detection is not done. Prediction-based outlier detection Why a two methods? Outlier Detection Algorithms Vikramaditya Jakkula
Live-monitoring method Uses Active LeZi (ALZ) [2] to find the expected pattern in the data. ALZ uses data compression to predict the next action in a sequence. It determines the probability distribution for each action at any point of time. When an action occurs this probability distribution is used to determine if the action is an outlier or not. Prediction-based Outlier Detection Vikramaditya Jakkula
To determine if an action x is an outlier we calculate the anomaly measure n(x). Two methods are used to calculate anomaly measure. Why? To determine the importance an outlier we calculate the urgency factor u(x) anomaly measure, n1(x) = 1, if ρ (x) * 100 < 1 1 , otherwise ρ (x) * 100 anomaly measure, n2 (x) = 1, if ρ (x) * 100 <= ρ (y) ρ (y) , otherwise ρ (x) * 100 Prediction-based Outlier Detection urgency factor, u (x) = n(x) * c(x) report if u (x) >= 0.1 Vikramaditya Jakkula
Which drift or outlier is important to report? Uses current classification, the previous classification, the criticality of the action, and other parameters (confidence, length of drifts etc.) Three levels Level one: Critical drifts and outliers Level two: Important drifts and outliers Level three: All drifts and outliers Report generation for Autocorrelation-based algorithms Vikramaditya Jakkula
Level one If action criticality is above medium, and either the classification changed from the previous or cycle period changes. Level Two All outliers criticality is above medium Previous classification changes cycle period changes confidence changes by some amount Level three Classification of each action. Report generation Vikramaditya Jakkula
HMS was tested using both synthetic and real data (activity and health). Five sets Synthetic set one Synthetic set two Real set one Real set two Health set Step1: verify algorithms using synthetic sets Step 2: analyze how the algorithm work on real and health sets Experiments Vikramaditya Jakkula
Synthetic set one To test autocorrelation-based algorithm Hundred days nine action 10639 data points Random criticalities Synthetic set two To test prediction-based algorithm 100 data points Four actions Nature of data Synthetic set one Vikramaditya Jakkula
Real data Activity data from MavPad Seven weeks Real set one – tested on prediction-based algorithm Electrical outlets usage, light usage and overhead fan usage. 2163 data points; 79 actions Real set two – tested on autocorrelation-based algorithm Real set one data plus motion sensor data 334935 data points; 157 actions Health Data – tested on autocorrelation-based algorithm Systolic, diastolic and hear rate are taken as action 2 months; one value each per day; each action is associated with its value instead of frequency Most missing values were added manually Nature of data Vikramaditya Jakkula
For Health Data sensitive to sudden large changes could detect drifts due to long term trends even with small amounts of noise. Experiments using Autocorrelation-based method Vikramaditya Jakkula
Figure: Line graph for graph confidence & diastolic vs. number of days for health set. Figure : Line graph for graph confidence & heart rate vs. number of days for health set. Vikramaditya Jakkula
Automation assistance is beneficial when activities are difficult to perform. Such reminder service would benefit individuals suffering from dementia. Reminders Triggered in two situations: when user queries for next routine activity Critical anomaly is detected. Reminder Assistance System Vikramaditya Jakkula
HMS help us gain information about different types of drifts and outliers that are part of the inhabitant’s lifestyle. Detect anomalies in inhabitants health. Gives information about sudden changes observed in inhabitants health. Successful demonstration of MavHome software Architecture can monitor and provide automated assistance for inhabitants. Conclusion Vikramaditya Jakkula
Future Work We are currently collecting health-specific data in the MavHome sites. We will be testing in the living environments of recruited residents at the C.C. Young Retirement Community in Dallas, Texas. Lifestyle Trends and patterns of inhabitants would be analyzed over period of time. Vikramaditya Jakkula
Thank You Vikramaditya Jakkula