Download
1 / 8
120 likes | 505 Views
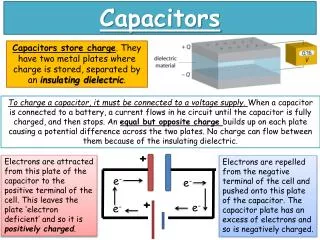
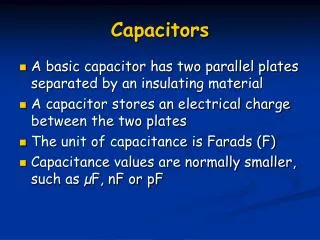
Capacitors 3. Capacitor Discharge. Rate of Discharge. We measure discharge using a circuit like this:. Suppose we discharge the capacitor for a short amount of time d t. R. C. V. mA. We know that:. So we can write:. At the moment of discharge, a current I flows:.

E N D
Capacitors 3 Capacitor Discharge Leeds City College
Rate of Discharge We measure discharge using a circuit like this: Suppose we discharge the capacitor for a short amount of time dt R C V mA We know that: So we can write: At the moment of discharge, a current I flows: And we can rearrange to: Rate of discharge Leeds City College
Fractional Discharge We can write the rate of discharge in calculus notation as: From basic capacitance we know Which we can substitute: Since: This is a differential equation of the form: We can rewrite this as k is the fraction by which x decreases Therefore: The minus sign tells us that the charge is decreasing 1/CR is the fraction by which Q decreases Leeds City College
Charging and Discharging a Capacitor If we discharge a capacitor, we find that the charge decreases by the same fraction for each time interval. If it takes time t for the charge to decay to 50 % of its original level, we find that the charge after another t seconds is 25 % of the original (50 % of 50 %). This time interval is called the half-life of the decay. The decay curve against time is called an exponential decay. We can plot a graph using a circuit like this: R C V mA The voltage, current, and charge all decay exponentially during the capacitor discharge. Leeds City College
Exponential Discharge Graph • We should note the following about the graph: • Its shape is unaffected by the voltage. • The half life of the decay is independent of the voltage. There is an important quantity called the time constant The time constant is the product of the resistance and the capacitance. Time constant = RC. Units are seconds (s). It may seem strange that ohms × farads = seconds, but if you go to base units, that’s what you find. Leeds City College
Exponential Discharge Q – charge (C) Q0– original charge (C) e – exponential number (2.718…) t – time (s) RC – time constant (s). Capacitors lose a constant fraction of their charge in each time interval. If the capacitor loses 10 % of its charge in the first second, it will have 90 % left over after 1 s. After 2 s it will have 81 % of its original charge. After 3 s, it will be 72.9… and so on. This means that the decay is exponential and fits the equation: The same equation can be written for the current: And the voltage: Leeds City College
RC and Half Life If we discharge the capacitor for RC seconds, we get: The half life is the time taken for the capacitor to discharge to 50 % of its original voltage. e-1 = 0.368. Therefore: Get rid of e by taking natural logs Therefore: So the time constant is the time taken for the capacitor to fall to 37 % of its original voltage. Half life is 69 % of the time constant Leeds City College
Exponential Charge In these graphs, the charge and the voltage show an exponential rise. The current starts off high, but gets lower. It shows an exponential decay. For interest only (it’s not on the syllabus):