1 / 0

MRI Artifacts in the Brain and Spine: The Good, the Bad, and the Ugly

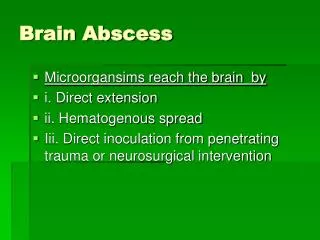
MRI Artifacts in the Brain and Spine: The Good, the Bad, and the Ugly. Electronic Education Exhibit: eEdE-27. Griffith B, Kolicaj N, Patel S, Corrigan J, Hearshen D Department of Radiology Henry Ford Health System Detroit, MI, US. Disclosures. Nothing to Disclose. Table of Contents.

keita
Download Presentation

MRI Artifacts in the Brain and Spine: The Good, the Bad, and the Ugly

An Image/Link below is provided (as is) to download presentation Download Policy: Content on the Website is provided to you AS IS for your information and personal use and may not be sold / licensed / shared on other websites without getting consent from its author. Content is provided to you AS IS for your information and personal use only. Download presentation by click this link. While downloading, if for some reason you are not able to download a presentation, the publisher may have deleted the file from their server. During download, if you can't get a presentation, the file might be deleted by the publisher.

E N D

Presentation Transcript


  1. MRI Artifacts in the Brain and Spine: The Good, the Bad, and the Ugly Electronic Education Exhibit: eEdE-27 Griffith B,Kolicaj N, Patel S,Corrigan J,Hearshen D Department of Radiology Henry Ford Health System Detroit, MI, US
  2. Disclosures Nothing to Disclose
  3. Table of Contents Introduction Purpose MR Hardware Artifacts Signal Processing Artifacts Physiologic Artifacts Foreign Body Artifacts Conclusion
  4. Introduction Magnetic resonance imaging (MRI) is an essential diagnostic tool in neuroradiology. However, MRI is prone to a number of artifacts, which can relate to a variety of factors, including hardware or processing issues, physiologic factors, and foreign bodies. Aside from effects on image quality, artifacts can play an important role in study interpretation, both for the good (e.g., detecting pathology) and bad (e.g., mimicking pathology). Despite the potential limitations artifacts introduce into MR interpretation, in the appropriate hands, these issues can be easily recognized and often corrected.
  5. Purpose The purpose of this exhibit is to explore the full spectrum of artifacts encountered in MR imaging of the brain and spine, including causesand potential solutions, thereby assisting neuroradiologists in recognizing and correcting potential issues.
  6. Approach/Methods Using case files, examples of various artifacts will be discussed, including those related to: MR hardware (e.g., zipper and inhomogeneity artifacts) Signal Processing (e.g., Gibbs phenomenon). Physiologic factors (e.g., CSF pulsation, blood flow) Foreign bodies (e.g., susceptibility artifact) Where appropriate, “clinical pearls” will emphasize those artifactsthat mimic pathology and those that can assist in diagnosing pathology. Pitfalls of particular imaging sequences and how choice of MR sequence may mitigate or enhance pathology will also be discussed.
  7. MR Hardware Artifacts
  8. Case 1: What’s the Problem?
  9. Case 1: What’s the Problem? Loss of fat saturation secondary to inhomogeneity artifact related to the patient’s dental hardware.
  10. Case 1: Inhomogeneity Artifact What Is It? Presence of an undesired signal intensity variation within an image1. Fig 1 What Causes It? Can be due to either non-uniform magnetic field or non-uniform sensitivity in a transmit or receive coil1. Certain RF coils (e.g., surface coils) display this artifact due to natural variations in sensitivity1. Fig 2 How Can It Be Fixed? Alternating 2 RF excitation pulses can cancel out the signal offset, but results in longer acquisition time (2x # of pulses). If related to non-uniformity in a receiver coil, machine recalibration or receiver self-calibrating techniques may be necessary. Fig 3 Clinical Pearl Sequences such as FLAIR and frequency-specific fat saturation are prone to inhomogeneity artifact due to reliance on a homogeneous magnetic field. Failed suppression of fat (as in Fig 1 & 2 due to the presence of a VP shunt catheter) and CSF (as in Fig 3 due to dental hardware) may mimic true pathology such as edema or CSF pathology, respectively.
  11. Case 2: What’s the Problem?
  12. Case 2: Corduroy Artifact (aka, Herringbone or Spike artifact) What Is It? Repetitive pattern of abnormal signal across entire image. What Causes It? Caused by aberrant signal amplitude (i.e., spike) at a location in raw data due to arcing, static discharge, etc. Although data problem occurs at one point, artifact occurs throughout entire image because data from every point in k-space contributes to signal throughout the entire image. Distance of spike from k-space center determines stripe width and quadrant of spike determines orientation. FT FT Images illustrate how introduction of a single focus of aberrant signal (spike) results in repetitive abnormality throughout the entire image following Fourier transformation (FT). How Can It Be Fixed? Correcting requires either re-scanning the patient or editing the raw data (if able) and reconstructing the image.
  13. Case 3: What’s the Problem? Case Courtesy JR Bapuraj
  14. Case 3: What’s the Problem? Axial FLAIR image demonstrates patchy hyperintensity within the right hemisphere. Sagittal T1-weighted image shows linear bands of artifact across the image. The artifact was discovered to relate to RF leak due to a pump that was situated on the patient’s right side on the initial scan. A repeat scan was performed without the pump and the artifact was no longer present. Repeat Scan Initial Scan
  15. Case 3: RF Leak Artifact What Is It? Failure of the RF shielding that allows external noise to reach the detector. Artifact depends on source of noise and where it is introduced into the signal. Most common artifact is a linear band across the image perpendicular to the frequency-encoding direction. What Causes It? Caused by RF interference picked up by the receiver coil of the imager along with signal from the patient. Source of interference is variable, including fluorescent lights, patient monitoring equipment, TV/radio, static discharge, and imager hardware. MR cervical spine images demonstrate a linear band across each image. Note that the direction of the band flips from horizontal to vertical as the frequency-encoding direction is changed (remains perpendicular to frequency encoding direction). How Can It Be Fixed? Correcting the artifact requires eliminating the external noise source. Possibilities include removing unnecessary monitoring devices, ensuring that the scan room door is closed and sealed properly, and improving the RF shielding.
  16. Case 4: What’s the Problem?
  17. Case 4: What’s the Problem? Axial FLAIR images demonstrate a tiny focus of hyperintensitynear the midline. The focus remained on every slice including the final image outside of the patient.
  18. Case 4: Central Point Artifact What Is It? Central point artifact is a focal dot of increased or decreased signal in the center of an image, which may also have a surrounding ringing artifact2,3. What Causes It? The cause of the artifact is a constant offset of DC voltage in the receiver, which subsequently leads to the presence of a bright dot in the center of the image following Fourier transformation2,3. How Can It Be Fixed? Can avoid this by using phase alteration of two excitation pulses, which will cancel out the signal offset (doubles acquisition time)2. Self-calibrating techniques and software correction can also minimize the problem. DWI images demonstrate a focal dot of increased signal in the center of the image.
  19. Signal Processing Artifacts
  20. Case 5: What’s the Problem?
  21. Case 5: Venetian Blind Artifact What Is It? Refers to signal intensity variations occurring after time-of-flight MRA images are stitched together. What Causes It? MRA can be performed with 2D or 3D technique. MOTSA (Multiple Overlapping Thin Slab Acquisition) uses multiple 2-3 cm thick 3D-TOF slabs allowing unlimited coverage (like 2D-TOF), but maintaining high spatial resolution (like 3D-TOF). With thicker slabs, signal intensity decreases as the vessel traverses the slab, most noticeably as the vessel exits the section. After stitching slabs together, signal intensity variation results in “venetian blind” artifact. Neck MRA shows numerous linear bands of altered signal intensity in a pattern referred to as “venetian blind” artifact. Venetian Blinds How Can It Be Fixed? Discarding outer portions of slabs reduces artifact, but decreases efficiency of technique (10-50% of slab removed). Use of variable flip angles (↑RF pulses) in the distal portion of the slab can correct for signal intensity loss. Other means of reducing artifact include smaller 3D volumes, thin slabs, and larger proportion of overlap4.
  22. Case 6: What’s the Problem? MRA images of the head demonstrate curvilinear hyperintensitiesbilaterally, which do not correspond to any true vascular etiology.
  23. Case 6: Wraparound (Aliasing) Artifact What Is It? Occurs when data from the object outside the field of view (but within the slice volume) is superimposed on the opposite edge of the image6. What Causes It? Results from mismapping of anatomy lying outside the FOV, but within the slice volume. Occurs when selected FOV is smaller than size of imaged object. Computer cannot properly recognize phase of signal beyond maximum value  those outside the range will “wrap around”5. How Can It Be Fixed? Using larger FOV, adjusting position of image center, or choosing coil that does not excite/detect spins from outside FOV (e.g., surface coil)1. Phase or frequency oversampling (no frequency/phase wrap) and saturating signals outside the FOV can also eliminate aliasing6. Clinical Pearl Wraparound is often by easily recognized. However, if only a small object lies outside FOV (e.g., ear-lobe wraparound), this can mimic pathology. Curvilinear hyperintensity due to aliasing of a portion of the patient’s ear.
  24. Case 7: What’s the Problem?
  25. Case 7: What’s the Problem? Sagittal T2-weighted image demonstrates a faint linear band traversing the center of the cord, which is not evident on the axial T2-weighted image.
  26. Case 7: Matrix Undersampling Artifact What Is It? Appears as bright or dark lines parallel to edges of abrupt signal intensity changes5. What Causes It? Undersampling of high spatial frequencies at sharp tissue interfaces (due to limited sample # or sampling time) leads to data truncation5,6,8. Also may occur when the number of peripheral Fourier lines in the k-space is small or insufficient5. How Can It Be Fixed? Increasing # of phase-encoding steps or decreasing the FOV will correct the artifact. Alternatively, placing the phase-encoding direction parallel to the spine will also help eliminate the problem5. Clinical Pearl Although truncation artifact can occur anywhere, it is common in spine imaging where alternating bright and dark lines on sagittal T2-weighted images may mimic syringohydromyelia4. Lack of corresponding abnormal signal on axial image confirms artifact.
  27. Companion Case: Matrix Undersampling Artifact Axial T2 FLAIR images of the brain demonstrate alternating bands of bright and dark signal, which remain parallel to the calvarium (sharp interface) and fade as they move further from the interface.
  28. Case 9: What’s the Problem? Fig 2 Fig 3 Fig 1
  29. Case 9: What’s the Problem? Fig 2 Fig 3 Fig 1 Sagittal T1-weighted image (Fig 1) demonstrates a lipoma within the quadrigeminal plate cistern with a T2 hypointense rim (Fig 2 & 3) along its posterior edge, which interfaces with CSF.
  30. Case 9: Chemical Shift Artifact What Is It? Misregistration of relative positions of two tissues with different chemical shifts. What Causes It? Most frequently occurs at the fat/water interface in the frequency encoding direction. Caused by difference in chemical shift (Larmor frequency ~3.5 ppm at 1.5T) of fat and water due to different micromagnetic environment. Fat and water spins in same voxel are encoded as in different voxels. How Can It Be Fixed? Fat suppression eliminates signal from fat (and therefore artifact). Switching phase and frequency directions changes direction of shift. ↓ Magnet strength, ↑ Bandwidth, ↑ Pixel size, Long TE  ↓ Artifact Clinical Pearl Chemical shift can result in apparent shift in location of lipomas and other fat-containing tumors8. Rim artifacts may mimic associated vessels and calcifications or hinder visualization of associated structures.
  31. Physiologic Related Artifacts
  32. Case 10: What’s the Problem?
  33. Case 10: CSF Pulsation Artifact What Is It? Low signal intensity or high signal intensity related to the pulsation of CSF. What Causes It? ~500 mL of CSF is produced daily, which moves in a pulsatile fashion due to cardiac cycle-associated expansion and contraction of the brain and intracranial vessels. CSF flow in C-spine is ~40% as fast as blood flow in carotid arteries6. Pulsatile CSF flow results in ghost images that propagate parallel to the phase-encoding direction. How Can It Be Fixed? Motion artifact reducing techniques such as flow compensation can help to minimize CSF pulsation artifact. Clinical Pearl Hypointense foci around the cord can mimic intradural masses or abnormal vasculature. Lack of CSF pulsation artifact can assist in diagnosing intradural arachnoid cyst. Sagittal and axial T2-weighted images show hypointense signal within the CSF space due to artifact related to CSF flow effects.
  34. Companion Case Clinical Pearl Although artifact often results in (or at the least, increases) diagnostic uncertainty, sometimes artifacts can assist in making the proper diagnosis. In this case, sagittal T2 images demonstrate a T2 hyperintense lesion dorsal to the cord with ventral cord displacement. Note the lack of CSF pulsation artifact within the lesion (signal actually appears brighter than remaining CSF), which helps confirm the diagnosis of intradural arachnoid cyst.
  35. Case 11: What’s the Problem? Case 9a Case 9b
  36. Case 11: Phase Encoded Motion Artifact What Is It? Random motion results in diffuse image noise with decreased definition while periodic motion results in ghosting (duplication of periodically moving structures) in the phase encoding direction5,7. What Causes It? Occurs when subject or part of subject changes location during a portion of the spatial localization process. Can result from voluntary (uncomfortable patient) or involuntary (physiologic motion) movements such as breathing, cardiac motion, pulsating blood, etc. Visible only along the phase encoding direction because each phase encoding step requires repetition of TR, which can take seconds to complete. Frequency encoding occurs in a single echo (too fast for physiologic motion). How Can It Be Fixed? Limit voluntary motion (have patient hold still, use sedation/pain medication) Options include respiratory compensation, fast scanning, sequential imaging (2D vs 3D) Clinical Pearl Ghost artifacts from pulsating blood vessels can mimic lesions in many locations in spine and brain imaging (aorta  spine; sigmoid sinus  posterior fossa; anterior cerebral artery  frontal lobes) Pulsation related motion should be equally spaced along phase encoding direction.
  37. Clinical Example: Phase Encoded Motion Artifact Repeat Study Initial Study Phase Encoding Direction Swapped Axial FLAIR image through the posterior fossa demonstrates a hyperintense focus in the left cerebellar hemisphere. After swapping phase encoding direction, the lesion within the posterior fossa disappeared confirming its artifactual nature.
  38. Case 12: What’s the Problem?
  39. Case 12: Flow Dispersion Artifact What Is It? Results in loss of signal on time-of-flight imaging due to complex flow. What Causes It? Complex blood flow (e.g., turbulence, non-laminar, flow separation) results in intravoxel phase dispersion with associated loss of signal6. Commonly seen in carotid bulbs of normal patients due to reversal of blood flow in the posterior carotid bulb10. More common in 2D imaging due to larger voxel size and longer TEs10. How Can It Be Fixed? Intravoxel flow dispersion can be minimized by using smaller voxel size and shorter TE (3D TOF has both). Flow compensation techniques and contrast enhanced MRA also can be used. Clinical Pearl Although commonly seen in the carotid bulbs, complex flow (and therefore flow dispersion) also occurs in areas of true pathology such as large ulcerations, aneurysms, and distal to true stenoses10. At the carotid bulb, artifact typically has ill-defined margins, intermediate signal, and preservation of posterior vessel wall10.
  40. Other Flow-Related Artifacts Directional Flow Suppression Flow Voids on T2 FSE Slow Flow on MRV MRV shows loss of signal within the left TV sinus. CTV shows a hypoplastic left sigmoid sinus and small jugular foramen. Axial T2 image shows loss of right ICA flow void. Normal flow voids are present in the basilar artery and left ICA. MRA shows loss of signal within the left MCA due to in plane saturation effect. Slow flow causes signal loss on phase contrast MRV. Commonly seen in non-dominant transverse sinus. CE-MRV/CTV, as well as assessing sigmoid groove and jugular foramen size may help differentiate hypoplastic sinus with slow flow and thrombus9. “Flow void artifact” on T2-FSE is used clinically to indicate presence of flowing blood. To generate a spin echo, proton must experience 90° and 180° pulse, which are slice selective. Blood moving quickly through the slice of interest will not generate an echo. TOF can demonstrate artifactual flow-related enhancement loss. Arterial loops lose signal where flow direction follows venous flow (thus, nulled by saturation band)10. Vessels traveling in the plane of data acquisition demonstrate decreased signal intensity.
  41. Foreign Body Artifacts
  42. Case 13: What’s the Problem?
  43. Case 13: What’s the Problem? Subsequent radiographs demonstrate a tiny metallic foreign body in that region. T2 and DWI images demonstrate susceptibility artifact in the left frontal region.
  44. Case 13: Magnetic Susceptibility Artifact What Is It? Loss of signal due to magnetic field inhomogeneity leading to a large area of central hypointensity. What Causes It? Ferromagnetic substances cause local magnetic fields, which distort the external magnetic field7. Magnetic field distortion alters the precession frequency of tissue, resulting in spatial mismapping of information. Type and severity of artifact is related to pulse sequence (EPI>GRE>CSE>FSE)1. T2 FSE How Can It Be Fixed? Options for reducing degree of susceptibility artifact include appropriate pulse sequence selection, ↓ voxel size, ↑ readout bandwidth, and use of view angle tilting (applies “compensatory gradient” during image acquisition to correct for inhomogeneity in the local magnetic field)11. T2 GRE Clinical Pearls Gradient recalled echo (GRE) sequences are very sensitive to presence of metal. Spin-echo (SE) sequences are less sensitive because 180° refocusing pulses correct for fixed magnetic field inhomogeneity, reducing signal loss from intravoxel dephasing. T2 FSE and T2 GRE images illustrate the differing sensitivity to metal (dental braces) between FSE and GRE.
  45. Susceptibility Artifact and T2* Imaging T2 FSE T2 GRE How Does It Work? Transverse relaxation following RF pulse results from random interactions occurring at the atomic and molecular level (primarily related to intrinsic field)13. In addition to irreversible dephasing, reversible bulk field dephasing (T2* effect) due to magnetic field inhomogeneity, differences in magnetic susceptibility of tissues/materials, etc. can be eliminated with a 180° pulse (spin-echo sequence)13. GRE sequences have no 180° refocusing pulse so transverse relaxation (T2*) includes both “true” T2 relaxation and relaxation due to magnetic field inhomogeneities13. ↑ magnetic field inhomogeneity  faster T2* relaxation  ↓ signal intensity on GRE images. Clinical Applications T2*-weighting can help identify paramagnetic deoxy-hemoglobin, methemoglobin, or hemosiderin. Common clinical scenarios include detecting parenchymal hemorrhage (amyloid angiopathy, DAI, etc.), DVA’s, and cavernomas. T2 FSE and T2 GRE images demonstrate the clinical utility of GRE sequences. Note the “blooming” of the lesions, which increases lesion conspicuity. This is most notable in lesions which are faintly evident on the FSE pulse sequence.
  46. Susceptibility Artifact and DWI Initial Scan The most commonly used technique for DWI is single-shot echoplanar imaging (EPI), which is insensitive to motion artifact given its short scan time, but is sensitive to susceptibility artifact due to local magnetic field inhomogeneities14. PROPELLER DWI is an FSE–based diffusion imaging technique that has better image quality near susceptibility-induced field gradients such as the skull base and also reduces artifacts due to metallic implants and dental fillings15. Repeat Scan The top images demonstrate a left paramedian pontine infarct, which could be mistaken for susceptibility artifact related to the adjacent skull base. A repeat scan with less artifact more clearly demonstrated the infarct. EPI-DWI PROPELLER DWI Above images demonstrate improved susceptibility artifact related to patient’s dental hardware when using PROPELLER DWI versus standard EPI-DWI.
  47. Clinical Pearls: Artifacts and Aneurysms Lipoma Aneurysm Coils Pneumatized Clinoid Pneumatization of the anterior clinoid process will appear hypointense on all pulse sequences and can mimic an aneurysm flow void (particularly when asymmetric as in the above case). Understanding the anatomic location of the anterior clinoid process is needed to differentiate it from an aneurysm12. Magnetic susceptibility artifact related to a prior aneurysm coil mass can mimic an aneurysm (as above) if history of prior coiling is unknown. Appropriate knowledge of the patient’s clinical history and correlation with other imaging modalities (such as CT) can help distinguish coil mass from aneurysm. TOF MRA is a T1 weighted sequence and therefore tissues with short T1 relaxation times (e.g. fat, blood) may appear bright. With background suppression, these T1 bright lesions may “shine through” on TOF MRA images. Evaluation of non-MRA T1 images is necessary to account for inherently T1 hyperintense lesions.
  48. Clinical Pearls: Unusual Foreign Body Artifacts Pantopaque CSF Gadolinium due to Poor Renal Function Subarachnoid Air T2 FSE DWI T1 and FLAIR images show sulcal hyperintensity. The patient had renal failure and underwent a CE-MRI the previous day. Gadolinium within the CSF results in T1 shortening which will appear as hyperintense signal on T1 and FLAIR images and can be mistaken for subarachnoid hemorrhageor meningitis. T2 hypointense foci within the right occipital subarachnoid space correlated with foci of radiopaque density on CT consistent with prior Pantopaque injection. Pantopaque is an oil-based contrast material previously used in lumbar myelography. T2 and DWI images demonstrate hypointense foci within the left cerebral subarachnoid space. History of LP prior to the MRI and negative pre-MRI CT confirmed subarachnoid air. Air appears as a signal void on MRI and introduces magnetic field inhomogeneity on DWI.
  49. Conclusions Despite its diagnostic capabilities, MRI remains prone to a number of artifacts that can diminish its usefulness, and in some instances, lead to incorrect diagnoses. Understanding the artifacts commonly encountered in imaging of the spine and brain, as well as appropriate steps to correct the artifact, is essential in neuroimaging. In the appropriate hands, MR artifacts can not only be effectively managed, but can also be used as helpful diagnostic tools.
  50. References Hashemi RH, Bradley WG, Lisanti CJ. MRI: The basics 3rd ed. Philadelphia: Lippincott Williams and Wilkins; 2010:185-214 Stadler A, Schima W, Ba-Ssalamah A, et al. Artifacts in body MR imaging: their appearance and how to eliminate them. Eur Radiol 2007:17:1242-55 Central point artifact. http://radiopaedia.org/articles/central-point-artifact Accessed March 23, 2014 Hakky M, Pandey S, Kwak E, et al. Application of basic physics principles to clinical neuroradiology: differentiating artifacts from true pathology on MRI. AJR Am J Roentgenol 2013:201:369-77 Vargas MI, Delavella J, Kohler R, et al. Brain and spine MRI artifacts at 3 Tesla. J Neuroradiol 2009:36:74-81 Sayah A, Mamourian AC. Flow-related artifacts in MR imaging and MR angiography of the central nervous system. Neurographics 2012:2:154-62 Smith AS, Weinstein MA, Hurst GC, et al. Intracranial chemical-shift artifacts on MR images of the brain: observations and relation to sampling bandwidth. AJR Am J Roentgenol 1990:154:1275-83 Erasmus LJ, Hutrter D, Naude M, et al. A short overview of MRI artefacts. SA J of Radiol 2004:8:13-17 Chiewvit P, Piyapittayanan S, Poungvarin N. Cerebral venous thrombosis: diagnosis dilemma. Neurol Int 2011; 3: e13 MR angiography: CNS applications. http://spinwarp.ucsd.edu/neuroweb/Text/MR-ANGIO.htmAccessed March 23, 2014 Stradiotti P, Curti A, Castellazzi G, et al. Metal-related artifacts in instrumented spine. Techniques for reducing artifacts in CT and MRI: state of the art. Eur Spine J 2009: 18:S102–S108 Aygun N, Shah G, Gandhi. Pearls and pitfalls in head and neck and neuroimaging: variants and other difficult diagnoses. New York: Cambridge University Press; 2013:264 Chavhan GB, Babyn PS, Thomas B, et al. Principles, techniques, and applications of T2*-based MR imaging and its special applications. Radiographics 2009: 29:1433-49 Fries P, Runge VM, Kirchin MA, et al. Diffusion-weighted imaging in patients with acute brain ischemia at 3 T: current possibilities and future perspectives comparing conventional echoplanar diffusion-weighted imaging and fast spin echo diffusion-weighted imaging sequences using BLADE (PROPELLER). Invest Radiol 2009:44:351-9 Bacci A, Agati R, Leonardi M. Recent developments and prospects in high-field MR. In: Salvolini U, Scarabino T, eds. High Field Brain MRI: Use in Clinical Practice. Berlin: Springer; 2006:127 Lipton ML. Totally Accessible MRI: A User's Guide to Principles, Technology, and Applications. New York: Springer Science+Business Media; 2008:150 Thank you! Brent Griffith (brentg@rad.hfh.edu) Suresh Patel (spatel@rad.hfh.edu)
More Related