Download

1 / 33
340 likes | 399 Views
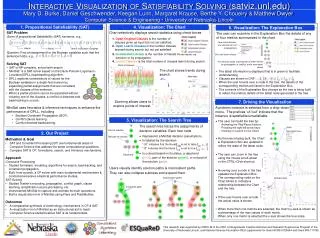
Designing the User Interface: Strategies for Effective Human-Computer Interaction Fifth Edition Ben Shneiderman & Catherine Plaisant in collaboration with Maxine S. Cohen and Steven M. Jacobs. CHAPTER 14: Information Visualization. Information Visualization. Introduction

E N D
Designing the User Interface: Strategies for Effective Human-Computer Interaction Fifth Edition Ben Shneiderman & Catherine Plaisant in collaboration withMaxine S. Cohen and Steven M. Jacobs CHAPTER 14:Information Visualization
Information Visualization • Introduction • Data Type by Task Taxonomy • 7 basic data types • 7 basic tasks • Challenges for Information Visualization
Introduction • “A picture is worth a thousand words” • Information visualization can be defined as the use of interactive visual representations of abstract data to amplify cognition (Ware, 2008; Card et al., 1999) • The abstract characteristic of the data is what distinguishes information visualization from scientific visualization
Introduction (cont’d) • Information visualization: categorical variables and the discovery of patterns, trends, clusters, outliers, and gaps • Scientific visualization: continuous variables, volumes and surfaces • Information visualization provides compact graphical presentations and user interfaces for interactively manipulating large numbers of items (102 to 106), possibly extracted from far larger datasets
Introduction (cont.) • Sometimes called visual data mining, it uses the enormous visual bandwidth and the remarkable human perceptual system to enable users to make discoveries, take decisions, or propose explanations about patterns, groups of items, or individual items • Visual-information-seeking mantra: • Overview first, zoom and filter, then details on demand • Overview first, zoom and filter, then details on demand • Overview first, zoom and filter, then details on demand
The seven data types • 1D Linear • One dimensional • Sequential organization • Examples: list of names, dictionaries, text documents, program source codes • Interface-design issues: colors, sizes, layouts, methods for overview, scrolling and selection • User tasks: find number of items, see items with some attributes (e.g., recently added), find most common items, see an item with all its attributes, etc.
The seven data types • 2D Linear • Two-dimensional, planar data • Examples: geographical maps, floor plans, newspaper layouts • Each item in the collection: • covers some part of the total area • has attributes such as name, value, owner • has UI features: color, shape, size, opacity • Multiple layers can be used, each 2D • User tasks: finding adjacent items, regions containing specific items, paths between items • Typical application: GIS, which constitute a large research and commercial domain
The seven data types • 3. 3D World • Three-dimensional, real-world objects • Examples: molecules, human body, buildings • Each item in the collection has volume and a complex relationships with the other items • Applications: medical imaging, architectural drawing, mechanical design, scientific simulations • User tasks deal with continuous variables such as temperature and density • Users must cope with position and orientation and must handle occlusion and navigation • 3D techniques are used in overviews, landmarks, teleportation, tangible user interfaces, multiple views
The seven data types • 4. Multidimensional data • N-dimensional, in which items with N attributes are points in ND space • Examples: most relational or statistical database contents • Representation is in 2D or 3D (with some issues related to disorientation and occlusion), with additional attributes controlled by sliders or buttons • User tasks include finding patterns such as correlations among pairs of variables, clusters, gaps, and outliers • Parallel coordinate plots are examples of compact MD techniques: each parallel vertical axis is a dimension, and each item is a line connecting values in each dimension
Data Type by Task Taxonomy: Multidimensional Data [Tableau Software]
Data Type by Task Taxonomy: Multidimensional Data (cont.) [Table Lens]
The seven data types • 5. Temporal data • Very common data type, usually 1D linear data + time stamps • Examples: weather data, electrocardiograms, stock market prices • Items have a start and end time and may overlap • User tasks: find items before, during, or after some event, plus the 7 basic tasks • Sometimes several time series are combined • Applications range from scientific data visualization to project management
The seven data types • 6. Tree data • Hierarchies or tree structures • Each item except the root has a link to a parent • Items and links to parents can have multiple attributes • User tasks include the 7 basic tasks on items and links, plus exploration of structure, e.g., shallow or deep hierarchy • Representation include usual tree graphs (e.g., degree of interest tree on the next slide), node-and-link diagrams, treemaps, and the outline style of indented labels used for example in Windows File Explorer
The seven data types • 7. Network data • Used when relationships among items cannot be captured properly with tree structures • Items are linked to an arbitrary number of other items in a network • User tasks: finding the shortest or least costly paths, traversing or navigating the network • Representations include node-and-link diagrams and matrices of items with cells showing potential links between the items (plus attributes on the link) • New interest in this topic has been spawned by visualization of social networks
The seven basic tasks Overview task - users can gain an overview of the entire collection Zoom task - users can zoom in on items of interest Filter task - users can filter out uninteresting items Details-on-demand task - users can select an item or group to get details
The seven basic tasks • 5. Relate task - users can relate items or groups within the collection • 6. History task - users can keep a history of actions to support undo, replay, and progressive refinement • 7. Extract task - users can allow extraction of sub-collections and of the query parameters
Challenges for Information Visualization • Importing and cleaning data • Combining visual representations with textual labels • Finding related information • Viewing large volumes of data • Integrating data mining
Challenges for Information Visualization (cont’d) • Integrating with analytical reasoning techniques • Collaborating with others • Achieving universal usability • Evaluation
Challenges for Information Visualization (cont.) • Combining visual representations with textual labels
Challenges for Information Visualization (cont.) • Viewing large volumes of data
Challenges for Information Visualization (cont.) • Integrating with analytical reasoning techniques