Download
1 / 6
60 likes | 280 Views
Case Study Smart Art. Team Type: Cross Functional Team Size: 6 members Project Meetings: 12 Primary Metric: Specific customer complaint on average every 19 days causes $75k in rework annually Root Causes: Communication, Process Flow, Records management Outcomes:

E N D
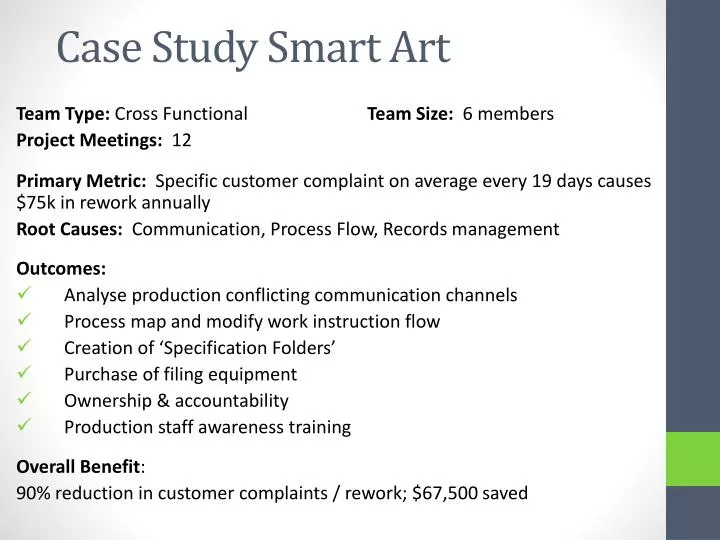
Case Study Smart Art Team Type: Cross Functional Team Size: 6members Project Meetings: 12 Primary Metric: Specific customer complaint on average every 19 days causes $75k in rework annually Root Causes: Communication, Process Flow, Records management Outcomes: • Analyse production conflicting communication channels • Process map and modify work instruction flow • Creation of ‘Specification Folders’ • Purchase of filing equipment • Ownership & accountability • Production staff awareness training Overall Benefit: 90% reduction in customer complaints / rework; $67,500 saved
Case Study _ Screw Loose Team Type: Cross Functional Team Size: 10 members Project Meetings: 12 / 5mths Primary Metric: Machine Set Up team spent 8% of ‘setting’ time searching for parts. Project Focus: Spare / consumable parts inventory control Root Cause: No sustainable and organised system in place Outcomes: • Critical parts identification • Min / Max stock levels set • Portable parts trolley for consumable spares • Reorder cards generated • Awareness training for Set Up team • Responsibilities allocated • Audit process implemented Overall Benefit: $50,000 production opportunity minus $1,000 in materials and in-house implementation labour
Case Study The Innovators Team Type: Area based Team Size: 12 (across shifts) Project Meetings: 8 Primary Metric: Screen damages were costing $8,000 /week Project Focus: Reduce damages by 75% Root Causes: Machine settings, calibration, training, repair technique Outcomes: • Blade angle trials and solution standardisation • Operator training • Manufacture calibration tool • Modify repair technique Overall Benefit: $300,000 saved in reducing production stoppages and replacement materials purchase.
Case Study _ Outside the Box Team Type: Cross Functional Team Size: 10 members Project Meetings: 6 Primary Metric: Bottling Line efficiency at 35%. Root Causes: Manning allocation to large batch packaging. Project Focus: Improve Overall Equipment Efficiency and produce to target. Outcomes: • Study of out-feed bottlenecks • Two shift approach • Shift One: Supplementary labour for trial, increase headcount x 1 • Shift Two: Shift 2IC manages supply chain to the line Overall Benefit: • Trial shifts averaged 113% OEE (2% difference between shifts) • Overall task averaged 84% OEE, inclusive of product changeover • 63% increase in production rates during the trial ($110k bonus) • Task completed with 72 man-hours of original planned labour to spare
Case Study _ Supa Green Team Type: Cross Functional Team Size: 6 members Project Meetings: 11 Primary Metric: Production income generated per Power Unit consumed Root Causes: Lighting design, machine operation and maintenance Project Focus: To increase income to power usage ratio Outcomes: • Lighting survey • Install energy efficient lighting to the factory • Repair sources of energy loss • Installation of timers • Staff awareness campaign Benefit / first six months, post solution implementation: • 21% power efficiency; $19k savings. • $700k production without power costs attached • Increased benefit with Carbon Tax implementation
Case Study _ Logistic Nightmares Team Type: Area based Team Size: 7 members Project Meetings: 9 Primary Metric: 14% complaint to Inventory Control process Root Causes: Time, accountability, process deficiencies Project Focus: Implement system to attain <90% compliance Outcomes: • Clarify and standardise Inventory Control process • Schedule cyclic counts • Set accountabilities and KPI’s • Train logistics staff Overall Benefit: Compliance to Legislative Authority targets 100% compliant to target with warehousing operations Solutions were able to be replicated in another area


![Smart Phone [ Case Study ]](https://cdn1.slideserve.com/3097560/smart-phone-case-study-dt.jpg)