Download
1 / 12
120 likes | 221 Views
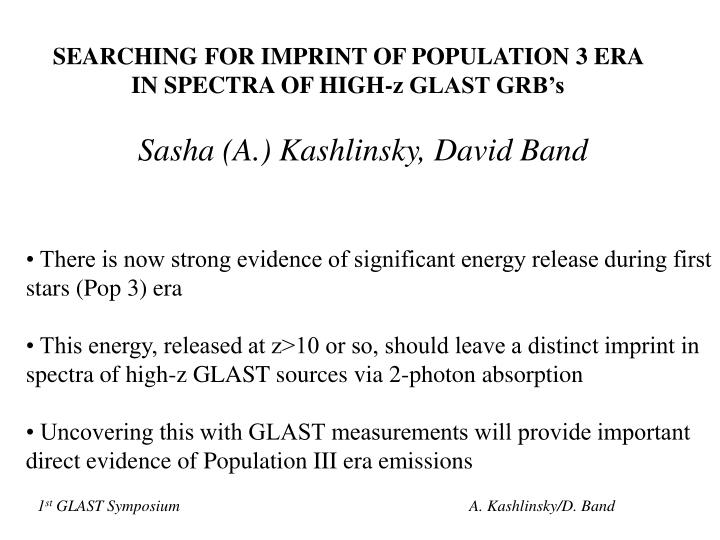
SEARCHING FOR IMPRINT OF POPULATION 3 ERA IN SPECTRA OF HIGH-z GLAST GRB’s. • There is now strong evidence of significant energy release during first stars (Pop 3) era • This energy, released at z>10 or so, should leave a distinct imprint in

E N D
SEARCHING FOR IMPRINT OF POPULATION 3 ERA IN SPECTRA OF HIGH-z GLAST GRB’s • There is now strong evidence of significant energy release during first stars (Pop 3) era • This energy, released at z>10 or so, should leave a distinct imprint in spectra of high-z GLAST sources via 2-photon absorption • Uncovering this with GLAST measurements will provide important direct evidence of Population III era emissions Sasha (A.) Kashlinsky, David Band 1st GLAST Symposium A. Kashlinsky/D. Band
Cosmic infrared background: measurements vs galaxies contribution From Kashlinsky 2005, Physics Reports, 409, 361 ● Direct near –IR CIB measurements show excess emissions over known galaxy populations (NIRBE). ● CIB from observed galaxy counts saturates with fainter “ordinary galaxies,” contributing very little extra flux ● Deep counts data (e.g. at 2.2 micron) show that <10% of the CIB flux is produced by ordinary galaxies at z>1 ● The observed CIB excess can be reproduced w. only ~2-4 % of baryons having gone through Pop 3 CIB due to J, H, K galaxy counts (For reference galaxies at K=20 are at z~0.8-1.2, e.g. astro-ph/0609287) 1st GLAST Symposium A. Kashlinsky/D. Band
● CIB data give: FNIRBE = 29+/-13 nW/m2/sr F(λ>:10μm) < 10 nW/m2/sr ● Diffuse background from Pop 3 (Kashlinsky et al 2004) ∫ M n(M) dM = Ωbaryon 3H02/8πG f* f* fraction in Pop 3 dV = 4 π cdL2(1+z)-1 dt ; L ≈ LEdd ∞ M ; tL = ε Mc2/L << t(z=20) ● The entire NIRBE can be reproduced with f* = 4 +/- 2 % for ε=0.007 1st GLAST Symposium A. Kashlinsky/D. Band
Near-IR CIB constraints from nearby blazars Aharonian et al (2006) HESS observations of two blazars at z ~ 0.18 ● HESS measurements suggest that for the assumed CIB template the levels of NIRBE are much smaller than claimed. 1st GLAST Symposium A. Kashlinsky/D. Band
Population III contribution vs HESS data: ● But substantial CIB levels from Pop 3 are still possible CIB: 1) ordinary galaxies contribution given by counts (red) 2) Pop 3 contribution: Iν∞λ-2 with z3=10 normalized to ΔCIB 1st GLAST Symposium A. Kashlinsky/D. Band
Residual CIB fluctuations in Spitzer GOODS images More direct evidence for significant emissions from early epochs is produced from studies of CIB fluctuations in deep Spitzer data (Kashlinsky, Arendt, Mather & Moseley 2005, Nature, 438,45 and 2007, ApJL, 654, L1 and L5 – reviewed also in Nature’s N&V on 3 Nov 2005 and 4 Jan 2007) Measured CIB fluctuations from remaining populations: 1st GLAST Symposium A. Kashlinsky/D. Band
Measurements of CIB fluctuations indicate: • The amplitude of the fluctuations implies CIB levels at 3.6 mic produced by these populations of >1-2 nW/m2/sr • These populations are such that they produce at most only low levels of the shot noise, but significant clustering component. • This in turn implies that the sources producing these fluctuations are individually faint with flux < 10-20 nJy • Such sources are very likely located at very early times of the Universe’e evolution. • At z=10 the Lyman cutoff for these emission is at λ~1 (z/10) μm, so the GLAST/LAT limit of 300 GeV implies that these photons can be detected via 2-photon absorption 1st GLAST Symposium A. Kashlinsky/D. Band
Pop 3 live at z > 10; hence any photons from them were produced then so that nγ∞ (1+z)3 or 4π/c Iν/hPlanck(1+z)3 per dlnE = 0.6 Iν(MJy/sr) (1+z)3cm-3 (γ-ray absorption due to CIB photons peaks at εγ if source is at z) 1st GLAST Symposium A. Kashlinsky/D. Band
Population III and high-z GLAST sources (GRBs/blazars) ● Two photon absorption due to these CIB photons would lead to a sharp cutoff at εcut = 260 (1+zGRB)-2 GeV (for z3=10) in the spectra of any high-energy GLAST sources such as GRBs. ● εcut (1+z3) where z3 is the typical epoch of Pop 3 emissions ● Lower NIRBE levels shift the curves vertically. ● The complete absorption feature is insensitive to > than an order of magnitude changes in CIB levels from Pop 3. From Kashlinsky (2005, ApJL,633,L5) 1st GLAST Symposium A. Kashlinsky/D. Band
Observability of Cutoffs by GLAST • εcut = 260 (1+zsource)-2 GeV is in LAT energy band • Is the sample of GLAST-observed sources large enough to detect the emissions from Pop 3 sources at z>10? • High-z (>3-5) blazars will provide a good data sample after ~ 1-2 yr • We estimate that GLAST will detect ~7 GRBs/yr with observable Pop 3 cutoffs. Estimate depends on: • Detectability of cutoff in LAT spectra (photon fluences) • Redshift distribution (distribution of εcut) 1st GLAST Symposium A. Kashlinsky/D. Band
Detectability of Cutoffs in GLAST Bursts From Omodei et al (2006) • Assume BATSE spectrum extrapolates to GLAST band (but there might be extra components). Use BATSE fluence distribution. Result: predicted distribution of bursts LAT will detect with more than a certain number of photons. • Assume cutoff is detectable if intrinsic spectrum should produce more than 7 LAT photons above εcut (P<10-3). • Result is number of bursts LAT should detect with given εcut. ~7 bursts/yr should be detected with εcut <10 GeV 1st GLAST Symposium A. Kashlinsky/D. Band
Redshift Distribution from Swift Cumulative Swift z-distribution (from catalog) Empirical fit • εcut corresponds to a redshift. What will be GLAST’s redshift distribution? • Use Swift’s observed z distribution (many simplifying approximations) • Convolve redshift distribution with LAT burst detectability • GLAST may detect εcut in ~7 bursts/yr. • But, will we know the redshifts of the GLAST bursts? • Swift will observe ~1/6 of GLAST bursts, ~40% of Swift bursts have redshifts • Ground followup observations based on GLAST positions • ‘Pseudo’-redshifts from relations among burst parameters (e.g., luminosity) 1st GLAST Symposium A. Kashlinsky/D. Band