Download
1 / 26
260 likes | 311 Views
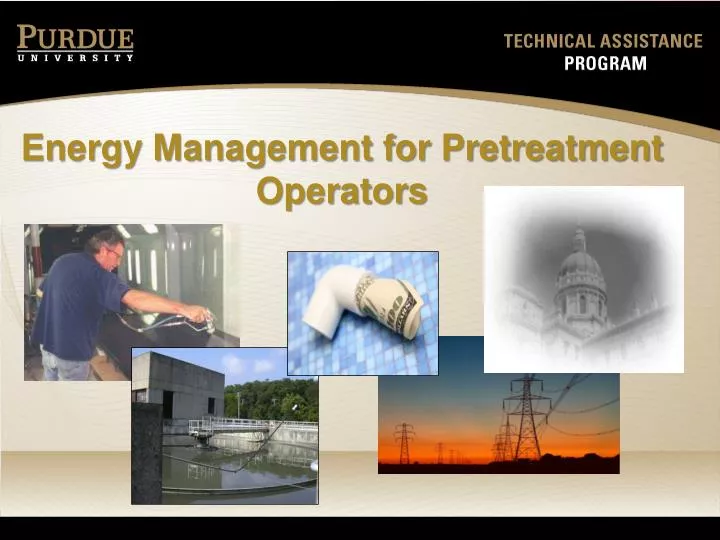
Energy Management for Pretreatment Operators. Getting Started?. Evaluate Your Consumption. Review energy bills actual use, demand, power factors, surcharges, number of meters … Map energy use & costs over time monthly, weekly, daily …. Look for trends

E N D
Evaluate Your Consumption • Review energy bills • actual use, demand, power factors, surcharges, number of meters… • Map energy use & costs over time • monthly, weekly, daily…. • Look for trends • seasonal trends, diurnal cycles, special events, changes in production rates…..
Understanding your Bills • Actual Use: actual power draw • Demand Charges: highest 15 minute draw, maximum transmission requirements • Power Factor (Reactive Power): energizing current for certain equipment • Fuel/Green Power Surcharge • Other miscellaneous trackers and charges
Survey Equipment and Facilities • List equipment: motors, compressors, heated tanks, boilers, lights, spray guns, vents, chillers.. • Note characteristics: size, age, load, condition….. • Look at use: what time of day, how long, what process, well matched…. • Building: windows, HVAC, doors, insulation…. • Evaluate water use
Survey WW Operations • Best TSS range for treatment • Minimum DO for best operations • Minimum velocity to achieve goal • Equipment (motors, pumps, tanks, VFDs) • Monitoring & recording • Regulatory requirements
Opportunities for Improvement • Reduced load through water conservation • Decrease operating hours/off peak usage • Wastewater treatment practices • Use gravity flow instead of pumps • Equipment size, type, condition
Optimize Motors • High efficiency motors • Proper size (70-90% load) • Use variable frequency drives • Proper pulley drive alignment & non-slip belts • Decrease idle time • Replace rather than rewind
See the System, Not just the Component
Designed for different function • Partially closed discharge valve • Discharge bypass line that stays open • Multiple parallel pumps with the same number always running • Noise at the pump (or elsewhere in system) • Excessive maintenance costs Signs of Inefficiencies
Boilers and Steam Systems • Insulate condensate return pipes & reservoir • Inspect & repair steam traps • Use exhaust heat to preheat make-up water or combustion air • Proper maintenance • Fire/water tubes cleaned? • Fuel air ratio properly adjusted?
Steam Wasted from Leaking Traps @ 100psi, 80% boiler efficiencySource: Energy Management Handbook-Fifth Edition
Compressed Air Systems • Monitor and repair leaks • Evaluate how & where it is used • Deliver only where needed • Store in accumulator tanks • Run only during production hours • Use the lowest operating pressure possible • Fresh air intake • Harvest waste heat and use elsewhere • Minimize air loss during condensate release
Example: Energy Loss from Leaks • 8,760 hours of operation • 10 leaks, 1/16” • 90 psi • Energy loss= 36,646 kWh/yr • Cost ($0.06/kWh) = $2,200/yr
Lighting Systems • Use energy efficient lamps, ballasts and fixtures • Install fixtures at the proper height • Use task lighting • Use the proper light levels • Use occupancy sensors
Example: Savings from Motion Sensor (33% savings) • 25 fixtures, F96, T12, 60W • 8,760 hrs = 30,222 kWh/yr • Energy cost = $0.06/kWh • Lighting cost = $1,813/yr • 2,920 hrs = 10,074 kWh/yr • Savings = $604/yr
Ventilation & Dust Collection • Vent to outside air only as needed • Minimize the volume of air vented • Use fans only during production • Filter and return ventilation air during heating season • Preheat return air in an air-exchanger • Use variable speed drive
Chillers & Cooling Towers • Use variable speed drive controls on fans and pumps • Use energy efficient fan and pump motors • Consider raising the chiller water temperature • Harvest heat for use elsewhere
Best Practices Workshops • Motors • Fans • Pumps • Compressors • Lighting • Steam • Process Heating • HVAC • Sustainability • http://www.mep.purdue.edu/events/default.aspx#ees
Upcoming Events • Fan Workshop • June 11, 201008:00AM-04:00PM Vincennes Univ. 850 College Ave. JASPER, IN 47546 • Steam System • June 22, 201008:00AM-04:00PM Vincennes Univ. JASPER, IN 47546 • June 23, 201008:00AM-04:00PM 6640 Intech Blvd. • Indpls, IN 46268
Guidebook for Public Utilities • Intended for Water and Waste Water Utilities • Energy Management documentation • Project identification and prioritization • Developing a systematic approach http://www.epa.gov/region1/eco/energy/pdfs/guidebook_si_energymanagement.pdf
Questions, Comments, Need Help? Ethan Rogers Manager EES 317-275-6817 earogers@purdue.edu