Download
1 / 13
130 likes | 197 Views

E N D
Cheese… to infinity and beyond!Our experiences on happy action fun day with science and math folk.Starring:Mellissa “Ricotta” RucksNathan “Provolone” LenstraDylan “Cheddar Cheese Nut Log” CanavanMike “Mozzarella” ComerfordGeoff “String Cheese Incident” GeltnerEllie “Missing Cheese” Porterfield
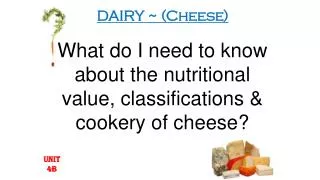
Does the relationship of the chemical attributes in cheese affect it’s taste?
Face it… people like cheese! But how can you tell what type of cheese tastes the best? From instinct? No way! Based on your friends’ opinions? Think for yourself man!
The next time you skip on down to your grocery store, just bring along your chem kit and test a hunk of cheese for it’s H2S, acetic acid and lactic acid content. It’s a sure-fire, no-brainer, point blank solution to making sure that the cheese you select is the tastiest of the bunch!
Graphical representation of H2S, acetic acid and lactic acid versus taste (of the cheese).
This data shows the relationship between the sum of the three chemicals and taste.
Math Learning Goals • Plot a graph • Read a graph • Determine the line of best fit • Determine the correlation between the chemical concentrations and cheese taste by graph analysis
Science Learning Goals • Conduct an experiment • Collect and record data • Control variables • Determine concentrations of cheese
Cheese Experiment • Students will conduct a taste test of fresh cheese, day old cheese, and week old cheese • Students will determine the chemical concentrations on lactic acid, acetic acid, and hydrogen sulfide • Students will plot graphs on graph paper of taste vs concentrations • Students will check graphs using Fathom • Students will determine the line of best fit and determine any correlations from the graphs • Students will write up their lab experiments
Innovations • Value of using technology--Fathom • Accurately determine the line of best fit • Easily change the variables of the axes • Gives the statistical correlation • Correlation value can help support hypothesis • Can use to check work
Value in integrating math and science • Math is necessary in a science class to analyze data and find correlations • Science is important in math to make some real world connections
Innovations in Diverse Populations • Everyone is familiar with cheeses and how they taste • Software is student friendly • Important to expose students to technology