Download
1 / 20
200 likes | 338 Views
Marginal Effective Tax Rates (METRs) across Europe. Alberto Tumino. 2 nd Microsimulation Research Workshop 11 th October 2012, Bucharest Preliminary: please do not cite without author’s permission. What are METRs?.

E N D
Marginal Effective Tax Rates (METRs) across Europe Alberto Tumino 2nd Microsimulation Research Workshop 11th October 2012, Bucharest Preliminary: please do not cite without author’s permission
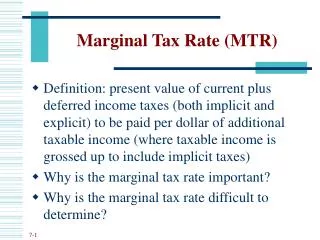
What are METRs? • Measure the proportion of a marginal increase in earnings that is taxed away because of taxes and/or benefit withdrawal • Indicators of the work incentive on the intensive margin of labour supply • High METRs Low incentive to increase labour supply
How are METRs calculated? • METRs calculation needs a microsimulation model • Calculation steps using EUROMOD: • Baseline household disposable income is calculated • The earnings of each earner in the household are increased in turn by a margin (3%) and new household disposable income calculated • Individual METRs are computed comparing the household disposable income after the increase in his/her own earnings with the baseline one
How are METRs calculated? METR101=1-[(253-250)/(206-200)]=50%
Conclusion • Wide variation of METRs across Europe • Medians and distributions • Changes between 2007 and 2010 • EUROMOD based METRs: • Great flexibility (margins and incomes) • Distributional analysis • Results representative at the population level • Breakdown by numerous perspectives • i.e. 1stvs 2nd earner, gender, age groups