Download
1 / 28
280 likes | 437 Views
Summary of soil P levels and stratification. GLPF Grant- Team meeting #5 July 23-24, 2013. Lake Erie eutrophication and dissolved P loads. Maumee and Sandusky Rivers are the two largest tributaries to Lake Erie 74-78% Agriculture. Data from: Heidelberg Tributary Loading Program .

E N D
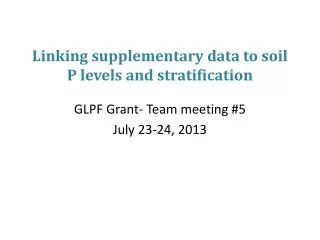
Summary of soil P levels and stratification GLPF Grant- Team meeting #5 July 23-24, 2013
Lake Erie eutrophication and dissolved P loads • Maumee and Sandusky Rivers are the two largest tributaries to Lake Erie • 74-78% Agriculture Data from: Heidelberg Tributary Loading Program
Conservation practices in the Lake Erie Watershed • Large-scale conservation practices have been adopted throughout the Lake Erie basin to reduce soil erosion • No-till or reduced till • Conservation reserve program • Has successfully reduced sediment loading (Richards et al. 2008, 2009)
Why is dissolved P increasing? From Sharpley 2003 From Vadas et al. 2005 • Typical agronomic soil tests use 0-8” cores • P stratification occurs under no-till practices from the lack of soil mixing and application of surface fertilizers • Runoff in Maumee and Sandusky Rivers tend to be surficial and interacts with the top 1-2” of soil
Why is dissolved P increasing? • Dissolved P in runoff can increase under no-till management From Kleinman et al. 2011
Research Questions • How high is soil P and what is the extent of P stratification in the Sandusky River Watershed? • Paired with certified crop advisors (CCAs) to collect soil samples from >1500 fields • Most soils were split into 0-2” vs 2-8” samples (n=1405) • A subset of soils were split into 0-1, 1-2, 2-5, 5-8” samples (n=234) • Mehlich3 extractable P measured at a soil test lab
Soil Profile
Research Questions • Does DRP readily exchange with the typical agricultural soil? • Dilute Aqueous Soil Solution (DASS) • Extracted DRP from 1 g of soil in 1 L of distilled water
Research Questions • Does DRP readily exchange with the typical agricultural soil? • DiluteAqueousSoil Solution (DASS) • Extracted DRP from 1 g of soil in 1 L of distilled water • How variable is P stratification within a given field spatially and temporally? • Select fields received gridded sampling every ~10 meters to examine spatial variation (n=78) • A subset of fields were sampled in 2009 and again in 2012 to examine temporal variation (n=74)
Soil P levels • Ranges from 2.8 – 291 ppm • Mean = 41.3 ppm • Median = 35.8 ppm • 90th percentile = 72ppm • 90% of the data are <72ppm 90th 75th 50th 25th 10th
The extent of P stratification • Top: Mean/median = 59/55 ppm, ranged from 4.0 – 319 ppm • Bottom: Mean/median = 35/28 ppm, ranged from 2.0 – 291 ppm • Top 2” are significantly higher than the bottom (paired t-test, P<0.001, n=1526)
The magnitude of stratification: ratio • The ratio of top:total ranged from 0.3 – 3.4 • Mean = 1.54 Median = 1.48 • The ratio was highest at lower soil test P • Dividing by a smaller # ? Top > Total Top = Total Top < Total *Using a correction factor not possible
The magnitude of stratification: ratio • Ratios need to be on a log-scale • Ratio 2:1=2 ; ratio 1:2=0.5 • The ratio is significantly higher than 1 (one-sample t-test, P<0.001)
The magnitude of stratification: difference • The difference (top–total) ranged from -78 – 176 ppm • Mean = 18 ppm Median = 15.8 ppm • The difference is significantly greater than zero (one-sample t-test, P<0.001) • The difference was highest at higher soil test P Top > Total Top = Total Top < Total
4-part stratification Median • Stratification evident even in the top 1” of soil (ANOVA, P<0.001, n=232) • Although the degree of stratification varied some… 60 54.5 49 34 26
4-part stratification Median • Stratification evident even in the top 1” of soil (ANOVA, P<0.001, n=232) • Although the degree of stratification varied some… • 85% of the samples had some degree of stratification 60 54.5 49 34 26
4-part stratification Median • Stratification evident even in the top 1” of soil (ANOVA, P<0.001, n=232) • Although the degree of stratification varied some… • 85% of the samples had some degree of stratification 60 54.5 49 34 26
Dilute aqueous soil suspension (DASS) • DRP from 1 g of soil extracted with 1 L of distilled water over 16h • DRP readily exchanges with water • Mean DRP = 0.037 mg P/L • Ranged from 0.003 – 0.115 mg P/L • DASS was positively related to soil test P (log-transformed, r2=0.73, p<0.001) • Mean DRP = 0.026 mg P/L • Ranged from 0.009 – 0.047 mg P/L
Temporal variation in P stratification Ratio Difference Total M3P • Sampled 74 fields in 2009 and again in 2012 • No distinct trends in how fields changed from 2009-2012
Temporal variation in P stratification • Significant, but slight increase in total M3P from 2009-2012 (means: 2009 = 43ppm, 2012 = 47ppm; paired t-test P=0.007) • No significant change in the ratio (means: 2009 = 1.83, 2012 = 1.81) or the difference (means: 2009 = 30ppm, 2012 = 32ppm)
Temporal variation in P stratification 2012 > 2009 2012 = 2009 • D M3P is the difference between 2012 and 2009 • Means: • Top= 5.9 ppm ± 3.0 SE *(significantly >0, one-tailed t-test, P=0.05) • Bottom = 4.1 ppm ± 2.1 SE • Total = 4.5 ppm ± 1.6 SE *(significantly >0, one-tailed t-test, P=0.05) • Top is more variable than bottom 2012 < 2009
Spatial variation in P stratification • Gridded sampling in 3 fields
Spatial variation in P stratification: Total M3P (ppm) Grid 2 Mean M3P: • Grid 1 = 50.5 ppm • Grid 2 = 54.1 ppm • Grid 3 = 58.4 ppm Grid 1 Grid 3
Spatial variation in P stratification: Ratio top:total Grid 2 Mean Ratio: • Grid 1 = 1.4 • Grid 2 = 1.3 • Grid 3 = 1.2 Grid 1 Grid 3
Spatial variation in P stratification: Difference top-bottom (ppm) Grid 2 Mean difference: • Grid 1 = 18.1 ppm • Grid 2 = 10.9 ppm • Grid 3 = 7.3 ppm Grid 1 Grid 3
Spatial variation in P stratification: Coefficient of Variation • CV= standard deviation mean • As much variation by field as across 1400 fields for total M3P and the difference • Variation in the ratio lower by field
Summary • Most (90%) total soil test P levels are <72ppm • Soil P stratification is prevalent in the Sandusky River Watershed • P in soil readily exchanges with water and this exchange is predicted by M3P • Fields tend to accumulate P over time and this accumulation appears to be higher in the top 2” of soil • Variation in P levels and stratification can be as high within a field as across 1400 fields