Download
1 / 22
220 likes | 244 Views
Insights into the construction of a Total Solar Irradiance composite and radiometer corrections, highlighting exposure-dependent changes and degradation patterns. Presentation at AGU Fall Meeting 2003.

E N D
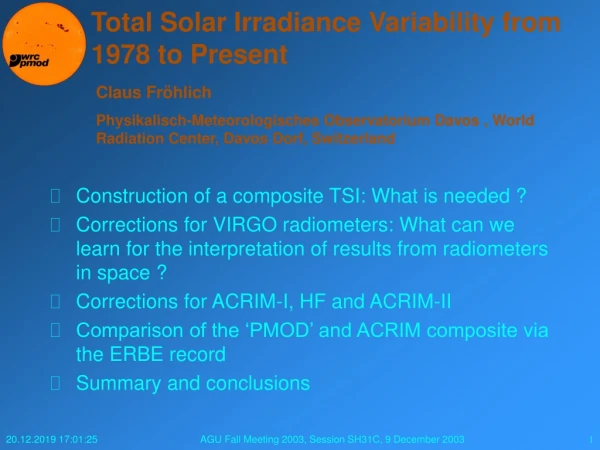
Total Solar Irradiance Variability from 1978 to Present Claus Fröhlich Physikalisch-Meteorologisches Observatorium Davos , World Radiation Center, Davos Dorf, Switzerland • Construction of a composite TSI: What is needed ? • Corrections for VIRGO radiometers: What can we learn for the interpretation of results from radiometers in space ? • Corrections for ACRIM-I, HF and ACRIM-II • Comparison of the ‘PMOD’ and ACRIM composite via the ERBE record • Summary and conclusions AGU Fall Meeting 2003, Session SH31C, 9 December 2003
Construction of a composite TSI: What is needed ? • Overlapping records. • Corrections for exposure dependent changes, by in-flight comparison with less exposed radiometers measurements or by modeling, developed from the behavior of similar radiometers on other missions. • Possibility of the assessment of other changes of sensitivity (non-exposure dependent changes, operational effects, ….) by comparison with simultaneous measurements from other radiometers. AGU Fall Meeting 2003, Session SH31C, 9 December 2003
VIRGO Radiometry: What can we learn? • SoHO at L1 provides continuous observation of the Sun with a very stable thermal environment (change of the order of 1 degree due to the annual distance variation). Thus the measurements are not influenced by sampling noise (aliases). As we want to see 5-minute oscillations the basic sampling is at a cadence of 1-minute. • VIRGO has two types of radiometers (DIARAD and PMO6V) which are different enough by design to allow to distinguish long-term changes from different origin. • The combination of both gives a representative test-bed for investigating the behavior of radiometers in space. AGU Fall Meeting 2003, Session SH31C, 9 December 2003
VIRGO Radiometry: Exposure dependent changes • Exposure dependent changes can be determined by comparing similar radiometers with different exposure times. Examples are ACRIM-I, II and III and the two types on VIRGO. • A model has been developed based on the effect of ‘sun-burn’ of quartz, which trans-forms the surface into Silicon which in turn reduces further degradation. • The dose can be calculated from e.g. MgII index. AGU Fall Meeting 2003, Session SH31C, 9 December 2003
VIRGO Radiometry: Degradation 1 • For DIARAD the model does not work. The behavior of DIARAD is quite different from the behavior of PMO6V, but it also completely different from what was observed during EURECA. Then, a degradation similar to PMO6 was observed, which is obviously not present on SOHO. . • For PMO6V the model is very important because PMO6V-B has also a substantial expo-sure time at the beginning. Thus, the corresponding changes have to be taken into account in an internally consistent way for both radiometers. AGU Fall Meeting 2003, Session SH31C, 9 December 2003
VIRGO Radiometry: Degradation 2 • For DIARAD the model does not really work. In order to reproduce the observed behavior two curves are needed with opposite signs ‘explain-ing’ an increase and decrease. • Immediately after the SOHO vaca-tions DIARAD-L shows a substantial degradation relative to R over a period of about one year. There is no obvious explanation for this change and IRMB in their most recent way of treating the degradation ot DIARAD-L ignore it and claim that DIARAD-R is wrong during that period. • Taking both DIARAD-L and R as reliable measurements, the degra-dation can be determined directly from the ratio, which is then smoothed and interpolated to the times of L as shown in the bottom panel. AGU Fall Meeting 2003, Session SH31C, 9 December 2003
3.82 Wm-2 0.79 Wm-2 VIRGO Radiometry: Degradation 3 • For PMO6V the corresponding changes have to be taken into account in an internally consis-tent way for both radiometers. This means that the same para-meters for the corresponding hyperbolic functions have to used. Only one free parameter is allowed, which is the factor to multiply the ensemble of the corrections of PMO6V-B to get the fit of the ratio constant in time. The factor is with 1.021 very close to one which demonstrates the internal consistency. • The early increase and short-term degradation are due to changes of the absorptivity of the precision aperture, which in turn changes its temperature. AGU Fall Meeting 2003, Session SH31C, 9 December 2003
VIRGO Radiometry: Non-Exposure dependent Changes 1 • By analyzing the ratio of PMO6V-A and DIARAD-L, both corrected for the exposure dependent effects, we can determine other changes, which are otherwise hidden. • The first incidence of an accidental 3-day switch-off in September 1996 showed that DIARAD slipped after switch-on and needed a substantial time to recover to the original level. This behavior was confirmed in February 2002, an other 2-day switch-off. An exponential function is used to correct for this effect. It is suggestive to assume that also at the initial switch-on and the one after the SOHO vacations may have a similar effect. The amplitudes for the short and longer interruptions are 0.21 and 0.39 Wm-2 with a time constant of 64 days. AGU Fall Meeting 2003, Session SH31C, 9 December 2003
VIRGO Radiometry: Non-Exposure dependent Changes 2 • The remaining difference (blue symbols in the top panel) can be fitted with an exponential function with 0.859 Wm-2 amplitude and 1005-day time constant and a change over the SoHO vacations of 270 ppm • The question whether this difference has to be attributed as an increase to DIARAD or as a degradation to PMO6V can only be determined by comparing the time series with ACRIM and ERBS. These show evidence for an increase in the sensitivity of DIARAD. • The share of the remaining differences is determined from the 200-day filtered ratio to ACRIM and shown in the bottom panel as dotted lines. AGU Fall Meeting 2003, Session SH31C, 9 December 2003
Conclusions from VIRGO Radiometry for the Construction of a Composite • The correction for degradation by comparison with one or two less exposed backups is a valuable and sufficient approach for radiometers with metallic joints within the heat-flux transducer (ACRIM, ERBS and PMO6V). However, if the exposure of the back-up is substantial, a corresponding model has to be applied which takes the early increase properly into account for both all radiometers. • Radiometers which have glued joints within the heat-flux transducer (HF and DIARAD) seem to show a long-term increase of their sensitivity independently of exposure. • Switch-off and on again may produce glitches with a rather long recovery. It is probably not a radiometric effect, but may be related to the control electronics. AGU Fall Meeting 2003, Session SH31C, 9 December 2003
VIRGO TSI from 1996 to present The VIRGO data set (VIRGO TSI, DIARAD and PMO6V TSI as hourly and daily values) is available from ftp.pmodwrc.ch/pub/data/irradiance/VIRGO/Data/TSI/as virgo_tsi_{h_ or d_}v6_000_0311a.dat. The version shown here, is more recent as indicated by 0312 and will be put on the net mid by December 2003. AGU Fall Meeting 2003, Session SH31C, 9 December 2003
Corrections for composite radiometers: ACRIM-I • ACRIM-I is the radiometric basis for the our composite • Corrections are, however, needed because we have arguments to distribute the observed degradation differently in time • Foukal and Lean (ApJ328, 347, 1988) suggested from comparison with their proxy model that the early degradation of ACRIM was probably underestimated • We do not base the correction on the comparison with models, but on published results from Willson and Hudson (Nature, 351, 42, 1991). The total correction which they determined from one comparisons with the back-ups in 1980 and one after the repair in 1984 amounts to 0.47 Wm-2. Due to the fact that during the spin mode of SMM exposure of the radiometer to the Sun was about 100 times less than during the period of normal operation in 1980, essentially all 0.47 Wm-2 have to applied during the observation period in 1980. They have accounted for 0.25 Wm-2 in the published data set, so we add the remaining 0.22 Wm-2 as a linear trend to the 1980 data set. AGU Fall Meeting 2003, Session SH31C, 9 December 2003
Corrections for composite radiometers:HF 1 • The early increase of HF shows an amplitude of about 2 Wm-2 which compares well with 1.6 Wm-2 for PMO6V. The amplitude of the exponential degradation is with 0.7Wm-2 similar to the short-term degradation of PMO6V. The linear increase is much stronger than what was determined for DIARAD. • Before we can make conclusive statements of the long-term behavior of HF, the whole analysis should be repeated with hyperbolic functions for degradation and exponential functions for the long-term increase – instead of the exponential and linear functions. AGU Fall Meeting 2003, Session SH31C, 9 December 2003
Corrections for composite radiometers:HF 2 • The most controversial correction is the one during the gap between ACRIM-I and II (black vertical lines). Indeed, the magnitude of the correction may still be disputed, but the need for a correction is nevertheless quite obvious (see also comparison of the PMOD and ACRIM composite with ERBS results) • In contrast to the originally proposed two glitches the present analysis identifies one glitch just after a switch-on and a linear trend. This trend turns out to be a continuation of the earlier one determined from comparison with ACRIM-I AGU Fall Meeting 2003, Session SH31C, 9 December 2003
Corrections for composite radiometers: ACRIM-II 1 • The absolute level of ACRIM-II has to be aligned with the one of ACRIM-I. This is done by searching the level of ACRIM-II which minimizes 2 of the 4 ratios of ACRIM-I and II to HF and ERBS. This is done with the corrected HF data and the result would be different if the correction is not applied. • The results show differences over the gap of 73, 41 and –40 ppm for the ratios ACRIM to ERBE, HF to ERBE and ACRIM to HF. The range may provide some information about the uncertainty AGU Fall Meeting 2003, Session SH31C, 9 December 2003
Corrections for composite radiometers: ACRIM-II 2 • In a next step the ACRIM-II time series is searched for slips after gaps. Important changes (green is the original and red the corrected) are observed after the early operation gap of UARS and around February 1998. ACRIM-III (blue line) is adjusted to ACRIM-II • The bottom panel illustrates how important sampling noise can be. Note the large difference between ACRIM-III to VIRGO and ACRIM-II to NIMBUS/HF AGU Fall Meeting 2003, Session SH31C, 9 December 2003
Data for ‘PMOD’ Composite With all the corrections applied, the necessary shifts can be determined from the ratio over always 200 overlapping days. The result of the shifts are summarized in the following table. With a factor of 1.0000 ACRIM-I is the reference. Period Radiometer Factor Comments 16/11/1978 …06/03/1980 HF 0:99682 06/03/1980 …12/11/1980 ACRIM-I 1:00000 12/11/1980 …03/05/1984 HF 0:99686 spin-mode period of SMM 03/05/1984 …02/06/1989 ACRIM-I 1:00000 02/06/1989 …22/07/1992 HF 0:99692 gap between ACRIM-I and II 22/07/1992 …07/02/1996 ACRIM-II 1:00215 after 1992 gap of UARS 07/02/1996 …27/05/2003 VIRGO 1:00105 Finally, the composite is adjusted to the Space Absolute Radiometric Reference (SARR) via the comparison with ACRIM-II. SARR has been introduced by Crommelynck et al.,1995 and is a reference which can be used for comparison. AGU Fall Meeting 2003, Session SH31C, 9 December 2003
The ‘PMOD’ Composite The composite is available from ftp.pmodwrc.ch/pub/data/irradiance/composite/Data/as composite_d26_00_0311a.dat. The version shown here is more recent indicated by 0312 and will be put on the net by mid December 2003. AGU Fall Meeting 2003, Session SH31C, 9 December 2003
Comparison of the ‘PMOD’ Composite with the original data sets AGU Fall Meeting 2003, Session SH31C, 9 December 2003
Comparison of both Composites with ERBE AGU Fall Meeting 2003, Session SH31C, 9 December 2003
Conclusions • With VIRGO we gained important new insights in the mechanisms governing ‘degradation’ • The ‘classic radiometers’ (ACRIM, ERBS, PMO6) do not show non-exposure dependent changes. And the exposure dependent changes can be well modeled with hyperbolic functions, which is important for backups with substantial exposures • Radiometers as DIARAD and HF show a slow increase of sensitivity with exposure to space • The effect of heating of the precision aperture seem to have a much larger influence than assumed • The uncertainty of a possible long-term trend of the composite can be estimated from the uncertainty of the determination of the slope of the ratio to the ERBS record which is ±21 Wm-2d-1 at the 1 level or ± 56 ppm per decade • The observed difference between the minima of –54 ppm is therefore not significant at the 1 level • We conclude that during the last 25 years the Sun shows only a negligible long-term trend AGU Fall Meeting 2003, Session SH31C, 9 December 2003
Note added: Flare seen in VIRGO TSI The strong flare of last October can obviously be seen in the total solar irradiance time series. The determination of the amplitude is, however, somewhat more difficult. There are several places where the beating of the different modes of the 5-minute oscillations produces peaks in the time series which can reach up to half of the peak observed during the flare. So the amplitude of the signal from the flare is estimated to be between somewhat less than 100 and a maximum of 200 ppm. AGU Fall Meeting 2003, Session SH31C, 9 December 2003