Download
1 / 31
310 likes | 465 Views
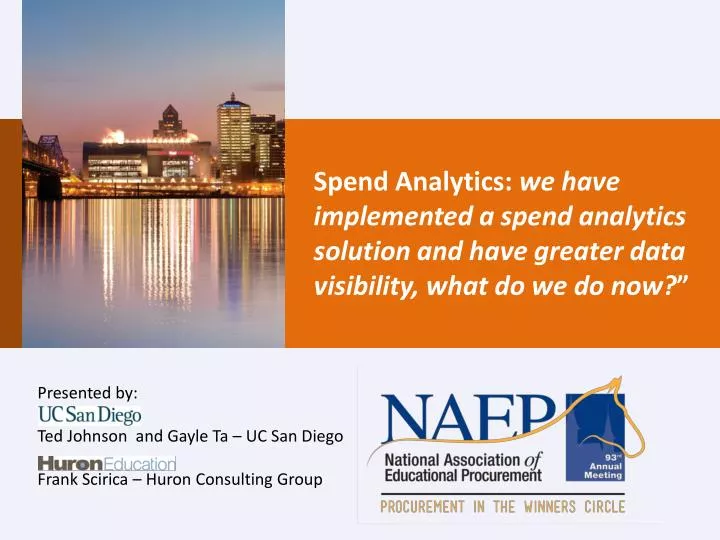
Spend Analytics: w e have implemented a spend analytics solution and have greater data visibility, what do we do now? ” . Presented by: Ted Johnson and Gayle Ta – UC San Diego Frank Scirica – Huron Consulting Group. Spend Analytics Overview. What is Spend Analytics?

E N D
Spend Analytics: we have implemented a spend analytics solution and have greater data visibility, what do we do now?” Presented by: Ted Johnson and Gayle Ta – UC San Diego Frank Scirica – Huron Consulting Group
Spend Analytics Overview • What is Spend Analytics? • The process of aggregating, classifying, and leveraging spend data for the purpose of reducing costs, improving operational performance and ensuring compliance
Spend Analytics Overview • Why is Spend Analytics important? • Spend data insight is critical for identifying hard-dollar savings opportunities and developing sourcing, budgeting and planning strategies • Drives purchasing compliance with negotiated contracts and identifies missed opportunities • Supports data driven communications to campus leadership, stakeholders, team members and suppliers • Universities require adequate oversight to ensure consistent compliance with Federal regulations, specifically as it relates to grants management • Pressures to extend value of existing sourcing, procurement and ERP technology investments
Spend Analytics Framework The graphic below demonstratesa typical framework for gathering, cleansing, enriching and analyzing data that can be leveraged for procurement projects and reporting.
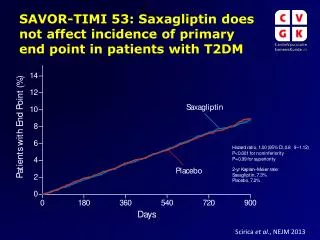
Spend Analytics Providing spend data to a solution provider for classification does not guarantee results. Knowing what to do with this data is the key to a successful program.
Spend Analytics – Spend Classification Leveraging analyzed category data, spend classification provides clarity of spend categories, subcategories and vendors as a starting point to identify sourcing related opportunities and broader category management.
Spend Analytics - Identifying Opportunities Once the area for analysis has been identified, remainder of activity can focus on identification of strategic sourcing opportunities and overall category management. Office Supplies Subcategories No. of Items Purchased Est. Annl. Spend ($K) • As the number of unique items increases, the number of price points received increases within a given category or product type • Product proliferation is particularly wide spread in ORP categories such as Filing & Record Storage, Technology, Converted Paper Products, Pens / Pencils & Corrections, and Other • Product rationalization savings opportunities exist across many product categories
Spend Analytics - Identifying Opportunities By identifying areas of spend, you can further segment by manufacturer to further refine potential sourcing opportunities. In this example, toner spend analysis highlights opportunities rationalize supply, increase use of the MFD fleetand consider remanufactured products. Toner Spend by Manufacturer • Combined purchases of HP, Staples Brand, and Dell toner products account for almost XX% of University’s total toner spend • The high-dollar amount and numerous manufacturer brands of toner suggests that the purchase and utilization of small-scale copiers and printers are likely prevalent on campus Opportunities: • Transfer independent printer volume to existing MFD fleet to reduce total campus printing costs • Rationalize supplier for greater discounts • Consider remanufactured product Toner Spend by Top Manufacturers • A wide range of discount levels were received on Toner products by the University; periodic price audits can be instituted to ensure pricing compliance with contracted general category discounts
Spend Analytics - Identifying Opportunities By analyzing manufacturer spend detail, you can further segment by product type to further refine potential sourcing opportunities. In this example, HP toner spend is broken down by top product type to highlight the potential savings benefits of remanufactured products. OEM v. Remanufactured Toner • The quality of remanufactured toner cartridges has improved dramatically since they were introduced 20+ years ago; high-quality remanufactured cartridges now undergo a process that makes them equivalent in performance, print quality and page yield to new models, requiring them to meet all OEM specifications • Environmental benefits of using remanufactured toner cartridges include keeping non-biodegradable material out of landfills and conserving the equivalent of three quarts of oil per cartridge • Industry Leader: MIT's Copy Technology Centers use remanufactured toner cartridges whenever possible, commenting that “the quality is great” Sample HP Toner Products with Spend Exceeding $20K • Increased utilization of reman toner can generate at least XX% in savings over OEM toner for top HP SKUs.
Spend Analytics - Identifying Opportunities In this example, copy paper spend is broken down by top product type to highlight the potential savings benefits of consolidating spend to best-value products. Top White Copy Paper Products By consolidating white copy paper purchasing on the SKU with the best-value ream price, the University will save $50K per year.
Spend Analytics – Compliance & Trend Monitoring Spend analysis as part of category managementwill facilitate the identification of purchasing trends, buying patterns as well as monitor utilization and spend consolidation of key strategic suppliers to support your category strategy. Spend Trend Shown at Category Level • Understand year-over-year category level spend trends Spend Trend Shown at Category Level • Monitor strategic supplier spend growth as well as non-strategic supplier spend reduction • Identify new suppliers entrance
Spend Analytics – Supplier Management In this example, spend and transaction analysis by supplier highlights preferred supplier volume and opportunities to manage non-preferred spend. Top 20 Suppliers by Spend Preferred Suppliers • The Top 200 facility supplies products by volume account for XX% of transactions and XX% of the spend • Lowe’s has the highest volume of all non-preferred suppliers (second overall by transaction volume) • Less than 1% of University’s suppliers are responsible for approximately 40% of the spend and 45% of the transactions
Spend Analytics UC San Diego– How do we get there? Manual Manipulation and Cleansing of data Dedicated Analytics Team Multiple Disparate Systems-no data Robust Data Dashboards Client-facing Data Enterprise Analytics System
Spend Analytics at UC San Diego • Department Focused Reports • Weekly Analytics • Quarterly Dashboard • Customer Focused Reports • MySpend • Department Brochures
Spend Analytics - Dashboard Performance Based Metrics
Spend Analytics - Dashboard Operational Metrics
Department Wide Dashboard Receiving Operation Metrics Supplier Diversity and Local Impact Customer Satisfaction Metrics
Spend Analytics - MySpend MySpend gives at-a-glance insight into your department’s spend and savings to help you understand and optimize your procurement activities by identifying where savings is being realized
Spend Analytics- Smart Analytics Webpage http://www-bfs.ucsd.edu/PUR/Analytics/Index.html
Closing Questions


![Huron [Wyandot]](https://cdn2.slideserve.com/4649325/kiran-laniece-damon-dt.jpg)