Download
1 / 36
360 likes | 368 Views
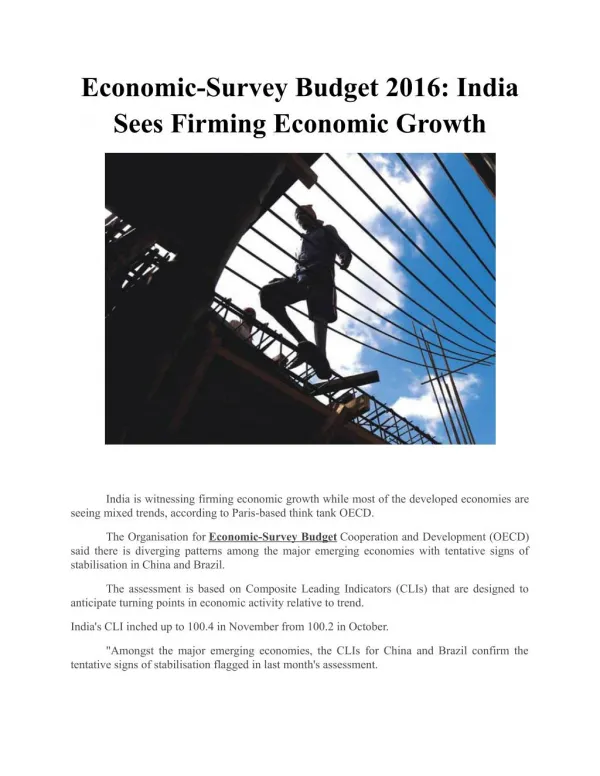
2017 OECD Economic Survey of India. Delhi, 28 February 2017. Strong reforms are boosting inclusive growth. http://www.oecd.org/eco/surveys/economic-survey- india .htm http://oe.cd/1No. @OECDeconomy. @OECD. Main messages. India is undertaking major reforms

E N D
2017 OECD Economic Survey of India Delhi, 28 February 2017 Strong reforms are boosting inclusive growth http://www.oecd.org/eco/surveys/economic-survey-india.htm http://oe.cd/1No @OECDeconomy @OECD
Main messages • India is undertaking major reforms • Prosperity is rising quickly, but growth could be more inclusive • Comprehensive tax reform, building up on the landmark GST reform, would lift all boats • Reducing regional inequality is key
Growth has been very strong Source: CSO; and OECD Economic Outlook 100 database.
Inflation is under control Source: Reserve Bank of India.
The current account deficit has narrowed Source: Reserve Bank of India.
Exposure to external risks is relatively low Note: Foreign-currency external liabilities are approximated by the sum of a positive difference between debt securities issued by nationals and residents from the BIS debt securities database (a proxy for off-shore external bond liabilities) and external liabilities for financial derivatives and other investments (the latter includes bank loans) from the IMF international investment position database. Source: Reserve Bank of India; Bank for International Settlements; and OECD calculations.
Structural reforms are boosting growth Source: OECD compilation.
India has been a top reformer Note: The FDI Regulatory Restrictiveness Index reflects the situation at end 2016 for India and at end 2015 for other countries. Data for Costa Rica refer to the period 2012-15. Source: OECD FDI Regulatory Restrictiveness Index database.
Inclusiveness stands high on the agenda • 1.1 billion unique identification numbers (Aadhaar) created to better target support to the poor • 276 million bank accounts opened for the poor since August 2014 • 34 million toilets built since October 2014 • 7 108 villageselectrified in 2015-16 (out of the 18 452 unelectrified villages)
It is crucial to revive investment Note: Gross fixed capital formation. Source: Central Statistical Organisation.
Non-performing loans are high Source: Reserve Bank of India and IMF.
More progress on FDI is needed Note: The FDI Regulatory Restrictiveness Index reflects the situation at end 2016 for India and at end 2015 for other countries. Data for Costa Rica refer to the period 2012-15. Source: OECD FDI Regulatory Restrictiveness Index database.
More social infrastructure is needed in some regions Source: NSS Report No. 566: Status of Education and Vocational Training in India; and Census of India. Data are for 2011-12.
Rural areas lack access to core infrastructure Source: Census of India 2011.
Public debt is high Data for India are revised estimates by the Reserve Bank of India for the fiscal year 2015-16. Source: OECD Economic Outlook 100 database; Reserve Bank of India; Brazilian ministry of economy; and World Bank World Development Indicators database.
Key recommendations to strengthen macroeconomic resilience and growth • Strengthen public banks' balance sheets by recapitalisation, bank consolidation and lowering the 51% government share • Increase public spending on physical and social infrastructure • Gradually extend the subsidy reform to other products including fertilisers and food • Raise more revenue, especially from property and personal income taxes, to ensure that government debt to GDP return to a declining path
GST is a landmark reformbut India needs to raise more revenue Source: OECD Economic Outlook 100 database; OECD Revenue Statistics database; World Bank; Reserve Bank of India; Central Statistical Organisation.
The personal income tax raises little revenue Note: Social security contributions are not included. Source: OECD Economic Outlook 100 database; OECD Revenue Statistics database; World Bank; Reserve Bank of India; Central Statistical Organisation.
Combined corporate tax rates are high Note: Foreign source income is assumed to be exempted in the residence countries. For India, the 45% rate comprises the 30% CIT rate on corporate profits, plus 12% surcharge on CIT and 3% earmarked tax (on CIT and surcharge amount), plus the 15% dividend distribution tax. Source: Thomas et al. (forthcoming).
Reducing the corporate tax rate would attract FDI Note: FDI net inflows are the value of inward direct investment made by non-resident investors in the reporting economy net of repatriation of capital and repayment of loans. Source: OECD FDI main aggregates database.
More resources for the tax administration would raise tax compliance Note: Data for India relates to the CBDT. Source: OECD (2015), Tax Administration 2013: Comparative Information on OECD and other advanced and emerging economies.
Key recommendations to ensure taxes better support inclusive growth • Remove the tax expenditures that benefit the rich most (e.g. those related to housing investment) and freeze the income thresholds from which rates apply. • Enable municipalities to raise more real estate taxes. • Implement the reduction in the corporate income tax rate from 30% to 25% while broadening the base. • Increase the number and training of staff employed in the tax administration.
Regional disparities are large Note: Regions in OECD member countries have been classified according to two territorial levels to facilitate international comparability. The territorial level 2 (TL2) consists of macro-regions, states in the case of India. Source: OECD Regional Statistics database.
There is little evidence that poor states are catching up Note: The population data are from Census 2001 and 2011. For the other years, population was estimated by linear interpolation and extrapolation. Source: Central Statistics Office; and NSSO.
Rural poverty is very high in some states Note: Poverty is calculated by using the Tendulkar methodology, which expresses the poverty line in terms of monthly per capita consumption expenditure based on a mixed reference period. Data refer to FY 2011-12. Source: Reserve Bank of India.
Productivity differences across states contribute to regional inequalities Note: Labour productivity is measured as the ratio of value added (GDP) per worker. Source: CSO; and OECD Economic Outlook 100 database.
Agriculture still employs many Notes: Employment data for China refer to the primary sector (including farming, forestry, animal husbandry and fishery). Source: NSSO; National Bureau Statistics of China; and World Bank.
Agriculture productivity is low Notes: Employment data for China refer to the primary sector (including farming, forestry, animal husbandry and fishery). Source: NSSO; National Bureau Statistics of China; and World Bank.
States’ ability to tailor public policies is high Source: CSO; and OECD Economic Outlook 100 database.
Urban population will increase fast in India Note: Forecasted data are shown in red. Source: United Nations, Department of Economic and Social Affairs, Population Division (2014).
Urbanisation gains are not fully exploited Note: Productivity is calculated as a median value added per worker in the organised manufacturing sector. Source: NSSO, Employment and unemployment survey, round No. 68; and World Bank Enterprise survey 2014.
Local air pollution is high Note: Indian cities are marked in red. The other selected cities are marked in blue. PM2.5 refers to particulate matter less than 2.5 micrometers in diameter; these fine particles are particularly damaging to health as they can penetrate deep into the lungs when inhaled. Source: World Health Organisation, Ambient Air Pollution Database, May 2016.
Key recommendations for a strong and balanced regional development • Continue efforts to improve universal access to core public services • Continue the benchmarking of states and strengthen the sharing of best practices, in particular on labour regulations and land laws • Enable reforms in land ownership laws, improve the land registry and step up the digitisation of land records • Give municipalities more and clearer spending and taxing powers
For more information….. Visit the OECD Economics department website to download this presentation; an overview of the 2017 Economic Survey of India and more www.oecd.org/eco/surveys/economic-survey-india.htm http://oe.cd/1No follow us on Twitter Keep up with the latest ideas with the OECD Economics department Blog https://oecdecoscope.wordpress.com/ OECD Economics OECD Disclaimers: The statistical data for Israel are supplied by and under the responsibility of the relevant Israeli authorities. The use of such data by the OECD is without prejudice to the status of the Golan Heights, East Jerusalem and Israeli settlements in the West Bank under the terms of international law. This document and any map included herein are without prejudice to the status of or sovereignty over any territory, to the delimitation of international frontiers and boundaries and to the name of any territory, city or area.