Download
1 / 16
160 likes | 368 Views
London, November 23, 2004 Seb Walhain. Environmental futures versus carbon cash products Combined physical and financial carbon hedging. Presentation outline . The carbon asset-liability ratio curve under the EU ETS The marginal abatement cost curve

E N D
London, November 23, 2004Seb Walhain Environmental futures versus carbon cash products Combined physical and financial carbon hedging
Presentation outline • The carbon asset-liability ratio curve under the EU ETS • The marginal abatement cost curve • Choosing make-or-buy based on the cash products market • Environmental futures as alternative to spot and forwards Developing the right trading and/or compliance strategy • Conclusions, merits of trading versus cost of compliance
EU Emission Trading Scheme • New assets, new liabilities, new values • Two main ways to reduce emissions under the EU ETS • Allowance trading sets a cap on emissions and companies can either buy or sell allowances depending on their emissions and the cost of abatement. • Credit origination involves generating credits by investing in individual projects in developing countries that reduce emissions The EU ETS covers ±46% of EU CO2 emissions Penalty of €40 per tCO2e (2005-2008) and €100 (2008 to 2012) Forward market semi-established into 2008, increasing liquidity and participation, decreasing volatility and contractual diversity
Value of allowances Expected value of total allocation expected ~ 14+ Billion Euro Value of traded market ~ 2 Billion Euros per year (at 5 Euro per tonne and 10% of allocated allowances traded) Allocated value to 15 major companies ~ 2750 M Euro
Accounting example of Asset to Liability 2005 Emissions per year = 1MtCO2 Total allocation per year = 0.9MtCO2 Value asset on allocation ~ Euro 7 million Value final short position ~ Euro -3 Million Estimate CO2 asset (IAS 38 Intangible Asset measured at fair value with all changes recognised in profit and loss. RECOMMENDED by IFRIC) Monitor CO2 liability (IAS 20)
Reducing CO2 in Poland - up to 4 times more effective • Influencing factors for carbon abatement costs: • Efficiency of power plants; • Age of power plants; • Type of fuel. • Costs to reduce CO2: • NL: ± € 20 per tonne; • Poland: ± € 5-7 per tonne: • Old (25 years and older) and inefficient (± 27%) power plants; • Main types of fuel are lignite and hard coal. • High emissions per MWh: large reduction potential. 1) 2) • Source: Coal Convenant, August 2000 • Costs to reduce 1 tonne of CO2 depends on type of technology.
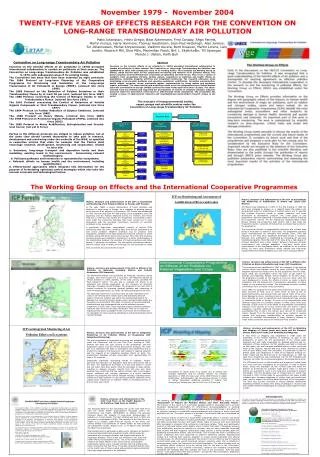
Marginal Abatement Costs M3 M2 M1 The Marginal Abatement Cost CurveCompany with 5m tons CO2 emissions 40 EUR/t Cost of Reduction Measures (M1-3) 30 20 10 1,5 0 0,5 1 2 3,5 4,5 5 2,5 3 4 Million tons CO2 Ref.: Evolution Markets
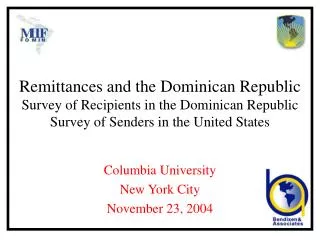
Worst Case Allocation Marginal Abatement Costs Market Price Make-or-buy versus the cash products market Costs lower than market price: Invest and sell! 40 EUR/t 30 20 10 1,5 0 0,5 1 2 3,5 4,5 5 2,5 3 4 Million tons CO2 Ref.: Evolution Markets
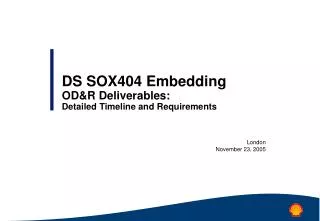
Hedging The use of market instruments (call and put options in this case) can narrow the price exposure and allow for better forward planning 40 30 EUR/t 20 10 2004 2005 2006 2008 2011 2013 2009 2010 2012 2007 Ref: Evolution Markets
Open H/C/T accounts IT and systems New IT and tracking systems 8 Brokerage agreements Verify actual emissions, registries Unclear fiscal treatment, VAT 3 Exchange agreements Optimise costs of trading (“bro”) and transfers (tax) Unclear accounting procedures 3 (ISDA, EFET, IETA) Standard contracts Intra / inter company position netting Credit approval new counterparties TRADE The trouble with trading..
Environmental Futures • Futures markets have two central roles: risk transfer and price discovery. • The fundamental difference between futures and forwards is the fact that futures are traded on exchanges and are standardised. Forwards trade over the counter and can be for any conceivalbe underlier and for any settlement date. • Forwards are entirely flexible. Parties to the contract decide on the notional amount and whether physical or cash settlement will be used. If the underlier is for a “physically” settled product like Allowances, parties agree on issues such as delivery point. • Forwards entail both market risk and credit risk. A counterparty may fail to perform on a forward. With futures, there is only market risk. This is because exchanges employ a system of daily margining that all but eliminates credit risk. Q3 ‘05 Futures Contract Q3 ‘05 Futures Contract Party A Clearing House Party B
CUSTOMER Carbon Banking at Fortis CUSTOMER Project financing Fortis fund for emission reductions Carbon for fund carbon origination Investment in funds Due diligence of financing mandates CUSTOMER CUSTOMER Position management and Trading services Carbon price info. Position management Registry management fees CUSTOMER
Carbon Banking at Fortis • A core environmental products team horizontally integrated across organisational boundaries and professional disciplines • MeesPierson InterTrust • Providing EUA and CDM registry and custodian services • Later using superior administration and interfacing for a user friendly interaction with registries • Global Markets • Environmental Products Trading Desk with CER and EUA lines and knock on impact advice to other desks, particularly energy desks. • Corporate & Investment Banking • Financial services including carbon value • CIB Project Finance • Incorporating carbon price in due diligence and Discounted Cash Flow Models • Equity investment • Investing in clean energy funds for the generation of emission reductions
Conclusions • The corporate efforts required to manage the financial consequences and administration for compliance under the EU ETS are considerable, and to actively trade the the market an effort must be made that is potentially very disproportionate to any returns to be had. • The market is shifting from driven by policy signals to driven by fundamentals (300% price difference!), and fluctuations in weather (climate!), energy prices and economic developments have great volatility inducing potential creating a large yet high risk market. • Portfolio pooling and compliance management outsourcing are alternatives well worth considering to developing own trading capabilities for over 90% of potential market participants.
Contacts • Seb Walhain • Seb.Walhain@nl.fortisbank.com +31 20 535 7295 • Claire Byers • Claire.Byers@nl.fortisbank.com +31 20 535 7020