Download
1 / 1
10 likes | 150 Views
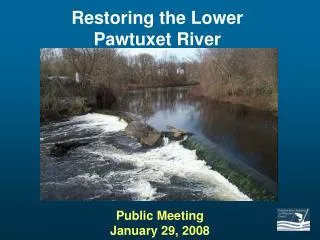
Assessing changes in contaminant fluxes following removal of a dam in the Pawtuxet River. Mark G. Cantwell † , Monique M. Perron ‡ , Julia C. Sullivan ◊ , David R. Katz † , Robert M. Burgess †

E N D
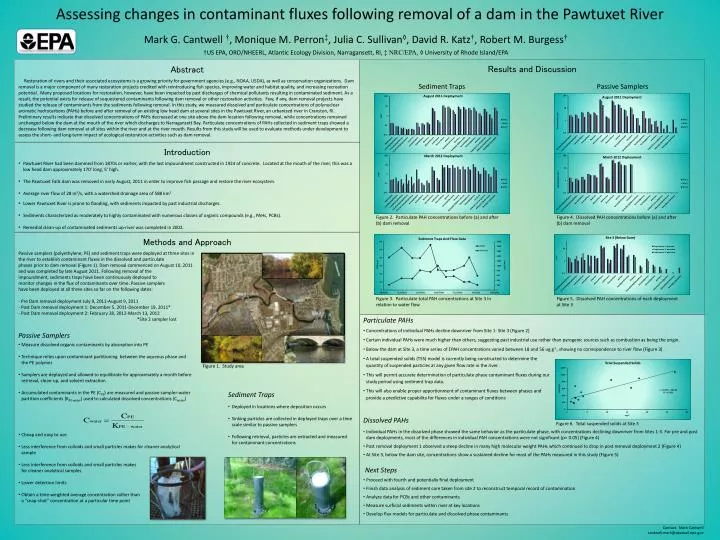
Assessing changes in contaminant fluxes following removal of a dam in the Pawtuxet River Mark G. Cantwell†, Monique M. Perron‡, Julia C. Sullivan◊, David R. Katz†, Robert M. Burgess† †US EPA, ORD/NHEERL, Atlantic Ecology Division, Narragansett, RI, ‡ NRC/EPA, ◊ University of Rhode Island/EPA Abstract Restoration of rivers and their associated ecosystems is a growing priority for government agencies (e.g., NOAA, USDA), as well as conservation organizations. Dam removal is a major component of many restoration projects credited with reintroducing fish species, improving water and habitat quality, and increasing recreation potential. Many proposed locations for restoration, however, have been impacted by past discharges of chemical pollutants resulting in contaminated sediment. As a result, the potential exists for release of sequestered contaminants following dam removal or other restoration activities. Few, if any, dam removal projects have studied the release of contaminants from the sediments following removal. In this study, we measured dissolved and particulate concentrations of polynuclear aromatic hydrocarbons (PAHs) before and after removal of an existing low head dam at several sites in the Pawtuxet River, an urbanized river in Cranston, RI. Preliminary results indicate that dissolved concentrations of PAHs decreased at one site above the dam location following removal, while concentrations remained unchanged below the dam at the mouth of the river which discharges to Narragansett Bay. Particulate concentrations of PAHs collected in sediment traps showed a decrease following dam removal at all sites within the river and at the river mouth. Results from this study will be used to evaluate methods under development to assess the short- and long-term impact of ecological restoration activities such as dam removal. Results and Discussion Sediment Traps Passive Samplers • Introduction • Pawtuxet River had been dammed from 1870s or earlier, with the last impoundment constructed in 1924 of concrete. Located at the mouth of the river, this was a low head dam approximately 170’ long, 5’ high. • The Pawtuxet Falls dam was removed in early August, 2011 in order to improve fish passage and restore the river ecosystem. • Average river flow of 28 m3/s, with a watershed drainage area of 588 km2 • Lower Pawtuxet River is prone to flooding, with sediments impacted by past industrial discharges. • Sediments characterized as moderately to highly contaminated with numerous classes of organic compounds (e.g., PAHs, PCBs). • Remedial clean-up of contaminated sediments up-river was completed in 2002. Figure 2. Particulate PAH concentrations before (a) and after (b) dam removal Figure 4. Dissolved PAH concentrations before (a) and after (b) dam removal Methods and Approach Passive samplers (polyethylene; PE) and sediment traps were deployed at three sites in the river to establish contaminant fluxes in the dissolved and particulate phases prior to dam removal (Figure 1). Dam removal commenced on August 10, 2011 and was completed by late August 2011. Following removal of the impoundment, sediments traps have been continuously deployed to monitor changes in the flux of contaminants over time. Passive samplers have been deployed at all three sites so far on the following dates: - Pre Dam removal deployment July 9, 2011-August 9, 2011 - Post Dam removal deployment 1: December 5, 2011-December 19, 2011* - Post Dam removal deployment 2: February 28, 2012-March 13, 2012 *Site 2 sampler lost Figure 3. Particulate total PAH concentrations at Site 3 in relation to water flow Figure 5. Dissolved PAH concentrations of each deployment at Site 3 • Particulate PAHs • Concentrations of individual PAHs decline downriver from Site 1- Site 3 (Figure 2) • Certain individual PAHs were much higher than others, suggesting past industrial use rather than pyrogenic sources such as combustion as being the origin. • Below the dam at Site 3, a time series of ΣPAH concentrations varied between 18 and 56 ug g-1, showing no correspondence to river flow (Figure 3) • A total suspended solids (TSS) model is currently being constructed to determine the quantity of suspended particles at any given flow rate in the river. • This will permit accurate determination of particulate phase contaminant fluxes during our study period using sediment trap data. • This will also enable proper apportionment of contaminant fluxes between phases and provide a predictive capability for fluxes under a ranges of conditions • Dissolved PAHs • Individual PAHs in the dissolved phase showed the same behavior as the particulate phase, with concentrations declining downriver from Sites 1-3. For pre and post dam deployments, most of the differences in individual PAH concentrations were not significant (p> 0.05) (Figure 4) • Post removal deployment 1 observed a steep decline in many high molecular weight PAHs which continued to drop in post removal deployment 2 (Figure 4) • At Site 3, below the dam site, concentrations show a sustained decline for most of the PAHs measured in this study (Figure 5) • Next Steps • Proceed with fourth and potentially final deployment • Finish data analysis of sediment core taken from site 2 to reconstruct temporal record of contamination • Analyze data for PCBs and other contaminants • Measure surficial sediments within river at key locations • Develop flux models for particulate and dissolved phase contaminants Passive Samplers • Measure dissolved organic contaminants by absorption into PE • Technique relies upon contaminant partitioning between the aqueous phase and the PE polymer • Samplers are deployed and allowed to equilibrate for approximately a month before retrieval, clean-up, and solvent extraction • Accumulated contaminants in the PE (CPE) are measured and passive sampler-water partition coefficients (KPE-water) used to calculated dissolved concentrations (Cwater) • Cheap and easy to use • Less interference from colloids and small particles makes for cleaner analytical sample • Less interference from colloids and small particles makes for cleaner analytical samples • Lower detection limits • Obtain a time-weighted average concentration rather than a “snap-shot” concentration at a particular time point Figure 1. Study area • Sediment Traps • Deployed in locations where deposition occurs • Sinking particles are collected in deployed traps over a time scale similar to passive samplers • Following retrieval, particles are extracted and measured for contaminant concentrations Figure 6. Total suspended solids at Site 3 Contact: Mark Cantwell cantwell.mark@epamail.epa.gov