Download
1 / 16
160 likes | 285 Views
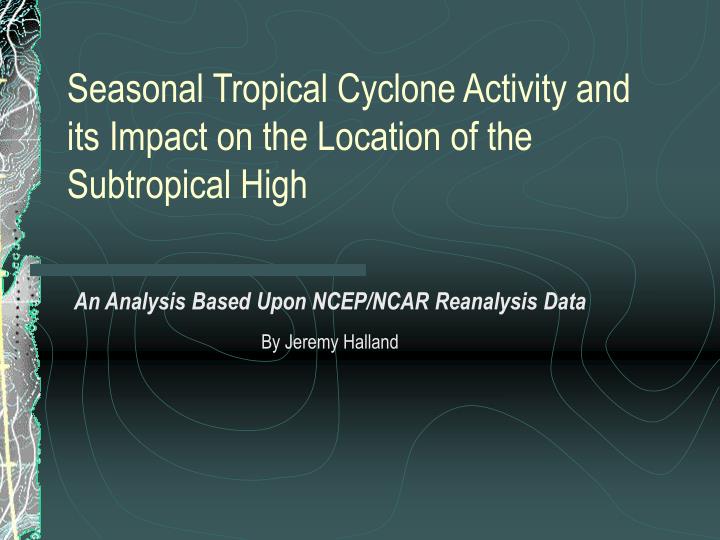
Seasonal Tropical Cyclone Activity and its Impact on the Location of the Subtropical High. An Analysis Based Upon NCEP/NCAR Reanalysis Data By Jeremy Halland. Outline of Presentation. What is the purpose of this analysis? Data Acquisition and Analysis Procedures Years Analyzed and Selected

E N D
Seasonal Tropical Cyclone Activity and its Impact on the Location of the Subtropical High An Analysis Based Upon NCEP/NCAR Reanalysis Data By Jeremy Halland
Outline of Presentation • What is the purpose of this analysis? • Data Acquisition and Analysis Procedures • Years Analyzed and Selected • Variables Used • Results • Geopotential Height Anomalies • 500 hPa Wind Vectors • Monthly and Monthly Anomalies • Similarities to El Nino • Conclusions
Purpose of the Analysis • Tropical cyclones are latent heat engines, whose main purpose is to help return balance the latitudinal temperature gradient. • A single tropical cyclone moving from tropics to mid-latitudes is estimated to decrease the pole-equator temperature gradient by ~1% • Thus, tropical cyclones serve a useful purpose, and annual differences in total TCs that both form and recurve has an impact on the following year’s weather.
Hurricane Andrew Courtesy of National Oceanic & Atmospheric Adminstration (NOAA) http://www.photolib.noaa.gov/historic/nws/wea00531.htm
Purpose of the Analysis • By examining years where the number of storms that develop below 25°N and either stay below 25°N or recurve past 40°N, I hope to find a correlation with: • the subtropical high intensity and location • trade wind strength and direction • How does the circulation in the winter months compare with circulation patterns during an El Nino event?
Data Acquisition and Analysis: Years Selected • NHC best track data from January 1950-February 2006 • Above = Years with • 1954,1955,1957,1958,1959,1960,1962,1972,1976,1995,1996,1997,1998 • Average: 1972.2 • Below = Years with • 1956,1968,1970,1971,1977,1978,1980,1982,1983,1984,1986,1992,2002 • Average: 1979.0 • Note that ‘Post’ corresponds to the year after in the group of years we are talking about (ie, year = 1956, post_year = 1957).
Data Acquisition and Analysis: Variables Used • NCEP/NCAR Monthly Reanalysis Data • Monthly Mean = or • Done for all 12 months of each year used • Variables Analyzed: • 500 hPa Geopotential Height • Mean Sea Level Pressure • 500 hPa Zonal and Meridional Wind • Surface Zonal Wind **AYM = Above Year month, and BYM = Below Year Month
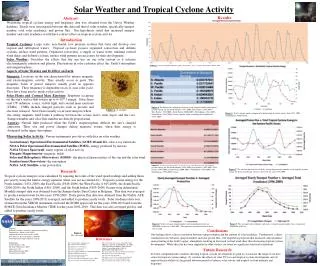
500 hPa Geopotential Height Differences • Notice similar pattern between ‘actual’ and ‘post’ years, except during winter months. • Post year has dominant lower heights in Jan. & Feb. while the actual year has dominant higher heights.
500 hPa Wind • The general wind pattern is observed in both ‘Above’ and ‘Below’ years. • Weakening of trades in the winter, strengthening of them in the summer. • Strengthening of mid-latitude winds in winter, weakening in the summer
500 hPa Wind Vector Differences • Reversal of dominant wind pattern occurs during winter and spring months. • Post November has cyclonic anomalies straddling the equator.. La Nina indicator?
El Nino Similarities: Geopotential Height • Notice the similar pattern and intensity of the high and low geopotential heights to La Nina. • Since this is Above – Below years, if we took below minus above we would have a plot similar to El Nino. Courtesy CDC: http://www.cdc.noaa.gov/ENSO/enso.description.html
El Nino Similarities: 500 hPa Wind Vectors • Note a switch in the high over low circulation in the ‘actual’ year to a low over high circulation in the ‘post’ year.
El Nino Similarities: Surface Zonal Wind • A strengthening of the easterly zonal wind in the western tropical Pacific in the ‘post’ years. • Thus, there is a more westerly zonal wind during the month of February in ‘below’ years.
Conclusions…. • There is a shift in location of the Pacific subtropical high towards the south, and also to form a more dominant presence in March instead of February. • There appears to be a significant correlation between years with less than 16% of its total TCs that form below 25°N recurve past 40°N and El Nino. • Forecasting El Nino?
References Chu, Pao-Shin. ‘Large-Scale Circulation Features Associated with Decadal Variations of Tropical Cyclone Activity over the Central North Pacific.’ Journ. of Climate. 15. 2678-2689. Hart, Bob. ‘Class Notes 2006.’