Download
1 / 24
270 likes | 369 Views
Learn the assumptions, types, and methods of cost behavior estimation, from linear to mixed costs. Explore regression analysis and the steps to estimate cost functions using quantitative analysis.

E N D
Chapter 10: Determining How Costs Behave Horngren 13e
Learning Objective 1: Explain the two assumptions frequently used in cost-behavior estimation . . . cost functions are linear and have a single cost driver Learning Objective 2: Describe linear cost functions. . . graph of cost function is a straight line and three common ways in which they behave. . . variable, fixed, and mixed Learning Objective 3: Understand various methods of cost estimation. . . for example, the regression analysis method determines the line that best fits past data Learning Objective 4: Outline six steps in estimating a cost function using quantitative analysis . . . the end result (step 6) is to evaluate the cost driver of the estimated cost function
Learning Objective 4: Outline six steps in estimating a cost function using quantitative analysis . . . the end result (step 6) is to evaluate the cost driver of the estimated cost function Step 1:Choose the dependent variable Step 2:Identify the independent variable, or cost driver. Step 3:Collect data on the dependent variable and the cost driver. Step 4:Plot the data. Step 5:Estimate the cost function. Step 6:Evaluate the cost driver of the estimated cost function.
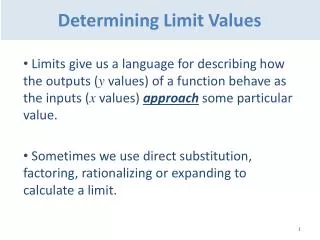
The Linear Cost Function y = a + bX The Independent Variable: The cost driver The Dependent Variable: The cost that is being predicted The slope of the line: variable cost per unit The Intercept: Fixed Costs
Regression Analysis • Regression analysis is a statistical method that measures the average amount of change in the dependent variable associated with a unit change in one or more independent variables • Is more accurate than the High-Low method because the regression equation estimates costs using information from all observations; the High-Low method uses only two observations
LEAST-SQUARES REGRESSION METHOD The least-squares regression method for analyzing mixed costs uses mathematical formulas to determine the regression line that minimizes the sum of the squared “errors.”
What is the estimated total cost at an operating level of 8,000 hours? (a) $43,740 (b) $36,670 (c) $37,125 (d) $46,875